Opening range breakout: strategy overview
The opening range breakout strategy analyses early session price ranges to identify potential breakout trades. The volume-weighted average price and fair value gaps are often used to refine entries.

The opening range breakout strategy focuses on early trading ranges to identify momentum-driven breakout opportunities.
The volume-weighted average price (VWAP) and fair value gaps (FVG) can support more precise entries.
Effective risk management, including controlled position sizing and average true range-based stop losses, is essential in fast-moving markets.
Opening Range Breakout Strategy: Fundamentals
The Opening Range Breakout (ORB) strategy is predicated on the premise that the price extremities established during the first few minutes of the trading session serve as foundational benchmarks for price discovery. These levels act as key order distribution zones that frequently reflect the subsequent directional bias of intraday market participants. By identifying these boundaries, traders can anticipate where institutional liquidity is likely clustered and where a decisive move may originate.
A bullish signal is traditionally triggered when a decisive upward breakout above the initial high of the first candle is observed—typically utilising closing prices on 5, 15, or 30-minute intervals. Conversely, a bearish signal is generated if the price penetrates the lower boundary of the range (the initial low). Although the underlying logic of the ORB strategy appears straightforward, practitioners must account for the high probability of mean reversion or "stop hunts." Since the market open is often characterised by the highest volume and volatility of the day—particularly within equity markets—failing to account for false breakouts can result in substantial capital impairment.
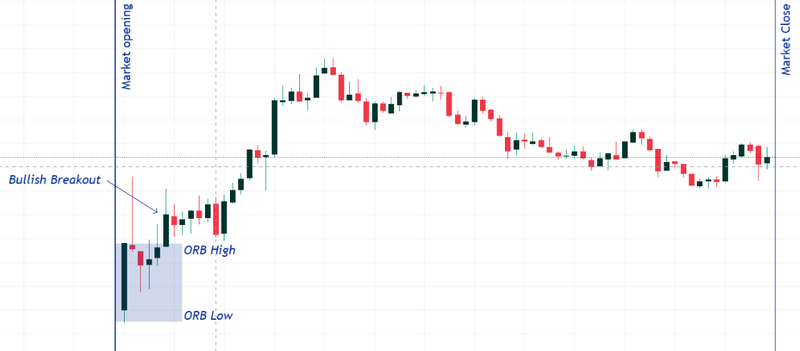
Figure 1. Opening Range Breakout Strategy (Bullish Example). Source: Own analysis via TradingView.
Timeframes in the ORB Strategy
The selection of a specific timeframe to establish the opening range is a critical variable that dictates the strategy's sensitivity and reliability. While there are no universal mandates regarding which interval is superior, market practice generally gravitates towards the 5, 15, and 30-minute durations, each offering a different balance of risk and reward.
- 5-Minute Range: The 5-minute ORB is primarily utilised by scalpers and high-frequency traders employing rapid-execution algorithms. The objective here is to capture the immediate impulse of the market, regardless of the significant noise and volatility present. Whilst this timeframe is statistically the most susceptible to premature stop-loss triggers due to erratic price action, a robust risk management framework can often compensate for these false starts and optimise the aggregate yield.
- 15-Minute Range: The 15-minute ORB represents a more balanced approach and is the preferred choice for many professional intraday traders. By allowing a more extended period for price discovery, volatility tends to stabilise, thereby establishing more reliable support and resistance levels. This timeframe effectively filters out a significant portion of retail "noise" and more accurately reflects the execution patterns of institutional algorithms.
- 30-Minute Range: The 30-minute ORB is favoured by intraday traders with a conservative risk profile and institutional participants who prefer to avoid the initial opening chaos. While volatility is typically lower following the close of the first 30-minute candle, the opportunity cost can be considerable. In many instances, the primary directional move of the day may already be partially priced in, potentially limiting the remaining profit margin for the trade.
Technical filters and confluence of indicators
In isolation, the ORB strategy may suffer from inconsistent profitability if it is not supported by technical confluences that enhance the probability of a successful breakout. Consequently, institutional traders often seek synergies between the ORB levels and indicators of volume, order depth, or structural market imbalances.
Volume-Weighted Average Price
The Volume-Weighted Average Price (VWAP) serves as a benchmark for the average price an asset has traded at throughout the day, weighted by both volume and price. This provides a more accurate reflection of the "true" market value compared to a simple moving average. The VWAP is calculated by summing the product of price and volume for all transactions and then dividing by the total volume traded for the period.
Within the ORB framework, a bullish confluence is established if the price breaks above the initial high while simultaneously maintaining a position above the VWAP. Conversely, a bearish bias is confirmed if the price breaches the initial low while remaining below the VWAP. This alignment allows that the momentum is being driven by significant market participation rather than low-volume anomalies.
Fair Value Gap Filter
A Fair Value Gap (FVG) identifies a specific type of market imbalance that occurs during rapid, impulsive price movements where the market fails to provide sufficient liquidity for all participants. When integrated into an ORB strategy, the FVG helps determine whether a breakout move is sustainable or merely an overextended spike. The strategy involves monitoring for the formation of an FVG immediately following an ORB breakout. Traders then wait for a retracement into this gap to "mitigate" the imbalance before entering the trade. The primary advantage of this confluence is the ability to utilise a tighter stop-loss, thereby significantly improving the risk-to-reward ratio.
Risk Management in the ORB Strategy
Rigorous risk management is the cornerstone of any sustainable trading methodology, and the ORB strategy is no exception. Given the heightened volatility of the opening session, traders must employ specific tools to protect their capital. The most widely adopted methodologies include the strategic application of technical stop-losses and precise position sizing.
Stop-Loss Risk Management
The implementation of a stop-loss is non-negotiable in professional trading. Within the ORB strategy, there are three primary methodologies for determining placement:
- Full Range Stop-Loss: This conservative approach involves placing the stop-loss at the opposite extremity of the opening range (the low for long positions and the high for short positions). While this provides the trade with the most "room to breathe," the distance may be significant, necessitating a reduction in position size to keep total risk within acceptable parameters.
- Average Point Stop-Loss: This criterion dictates placing the stop-loss at the 50% retracement level of the opening range. Whilst this improves the potential risk-to-reward ratio and limits the nominal loss per trade, it increases the likelihood of being stopped out by minor fluctuations in high-volatility environments.
- ATR-Based Stop-Loss: This dynamic approach utilises the Average True Range (ATR) to adjust the stop-loss according to current market volatility. A common application involves setting the stop-loss at a multiple (e.g., 1.5x) of the ATR from the entry point. This ensures that if volatility expands, the stop-loss widens proportionally, protecting the position from standard market noise.
Position Sizing and Maximum Loss Permitted
Position sizing is the process of defining a fixed percentage of total account equity to be risked on any single trade. For instance, if a trading account maintains a balance of $10,000 and the trader adheres to a 2% risk rule, the maximum loss permitted (or the margin to use) for a single position is $200 ($10,000 * 0.02). This discipline ensures that the trader can survive a series of losses without suffering a catastrophic drawdown. This approach is particularly critical when trading leveraged instruments, such as Contracts for Difference (CFDs) or Futures, where small price movements can have a disproportionate impact on account equity.
Conclusion
In conclusion, the ORB strategy remains a highly effective tool for day trading when implemented alongside robust technical confluences and disciplined risk management. Success is not merely a product of identifying a breakout, but of filtering market noise through the use of volume and volatility indicators. By employing rigorous position sizing and technical stop-loss methodologies, traders can capitalise on institutional momentum while safeguarding their capital against the inherent uncertainties of the market opening.
If you're interested in trading indices, foreign exchange, or commodities, consider exploring the CFD contracts offered by Equiti Group. Please note that trading leveraged derivatives involves a high level of risk and may not be suitable for all investors.
FAQs
What is the main difference between trading ORB in 5 minutes vs. 30 minutes?
The primary distinction lies in the trade-off between sensitivity and reliability. The 5-minute range facilitates early market entry, which is ideal for scalpers, yet it remains highly susceptible to market noise and "bull or bear traps." In contrast, the 30-minute range offers more established and reliable structural levels favoured by institutional participants, though it carries a higher opportunity cost as the day's primary trend may already be significantly developed.
How does VWAP help filter out false signals on a breakout?
The VWAP functions as an anchor of institutional value. A breakout above the opening range high is only viewed as a high-probability event if the price is also trending above the VWAP, confirming that the bullish impulse is supported by actual traded volume. If the price breaches the range but stays below the VWAP, it often indicates a "buyer's trap" lacking genuine institutional backing.
What does the confluence with the Fair Value Gap (FVG) consist of?
The FVG identifies structural imbalances following impulsive price action. Rather than entering a breakout immediately, the trader waits for an FVG to manifest. An entry is then sought during a pullback into this gap to capitalise on the market's attempt to neutralise the imbalance. This technique allows for more precise execution and an optimised risk-reward ratio by facilitating a tighter stop-loss placement.
Which Stop-Loss method is most recommended in the face of high volatility?
In scenarios of heightened volatility, the Average True Range (ATR) method is generally superior because it adapts to dynamic market conditions. While a "full range" stop might be excessively wide and a "midpoint" stop too sensitive to noise, the ATR provides a statistically grounded clearance. As volatility increases, the ATR moves the stop-loss away proportionally, preventing premature exits caused by standard market fluctuations.


