Indices Trading
Learn about the different types of indices, how to trade them, and the risks and opportunities associated with index CFD trading.
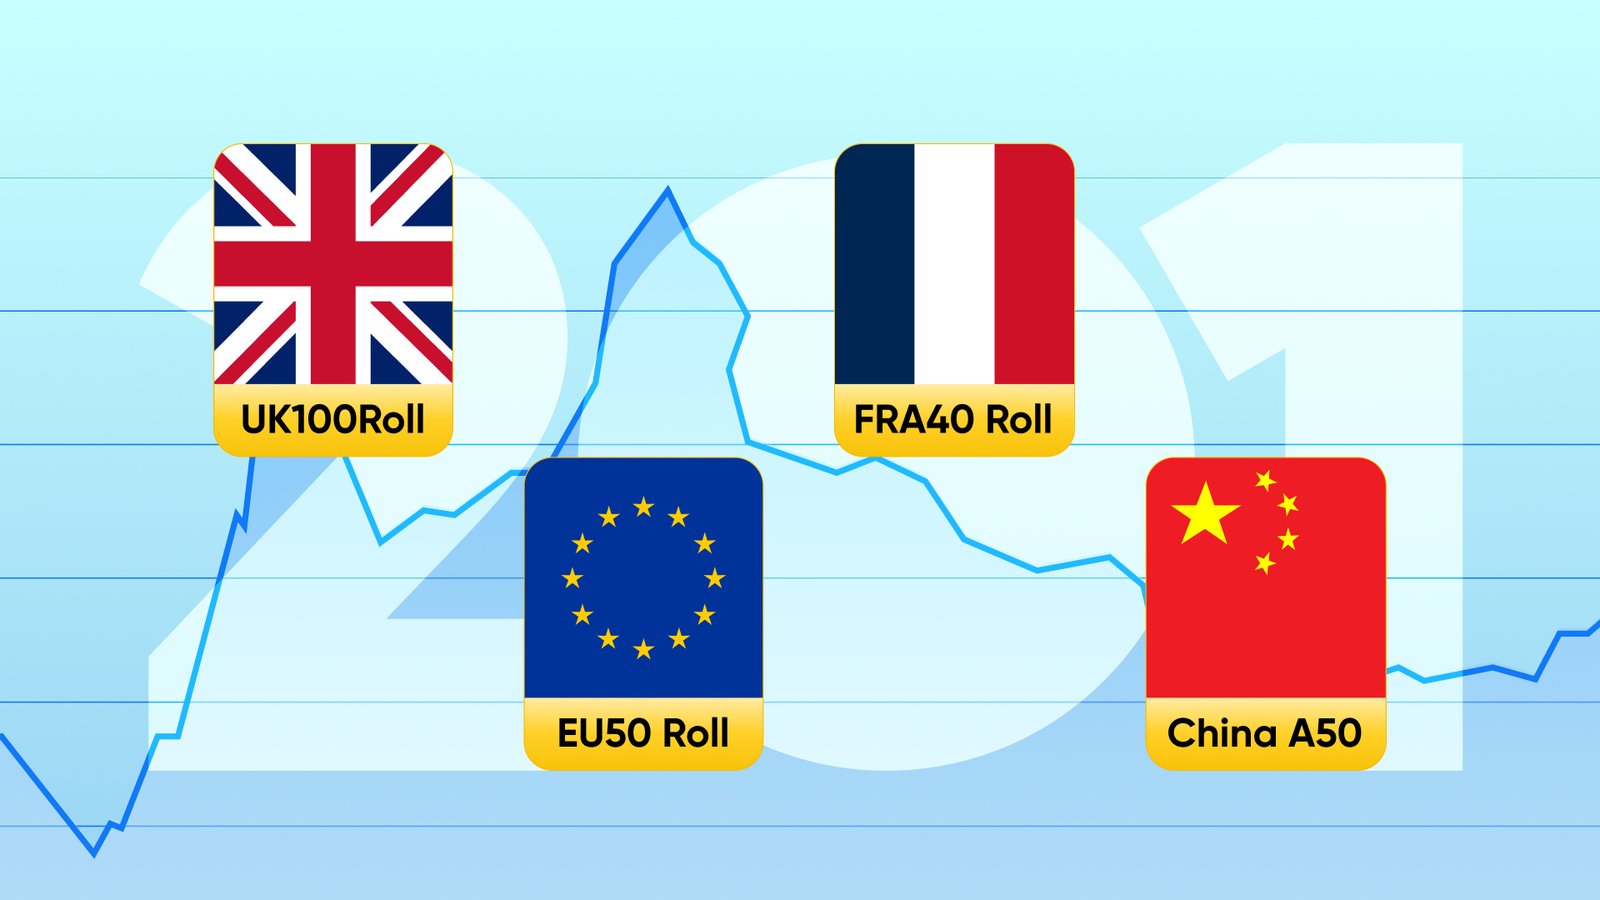
Stock market indices, commonly also referred to as benchmark indices, are used by traders and investors to gauge the performance of a stock market, sector, or industry
Indices CFD trading refers to speculating on the price movement of an index, rather than directly buying the asset itself
Leveraged CFD index trading can magnify your potential profits but also your potential losses, which means effective risk management will be essential to your strategy
CFD index traders track stock performance trends, macroeconomic news, and macroeconomic indicators to gain an edge and predict price moves at the optimal moment
About index trading
An index refers to a single number calculated from an array of prices and quantities. In financial markets, an index generally means a weighted average of financial market assets trading in a sector, industry, exchange, or the overall market. The plural of an index is an indices.
A basket of stocks is an example of an index. Among the most prominent indices are S&P 500, Dow Jones Industrial Average, NASDAQ Composite and FTSE 100.
Indices help investors track and assess the general direction of the market (or specific segments of it) and offer insights into market sentiment. For example, the S&P 500 includes 500 of the largest publicly traded companies in the US, offering an overview of the US stock market’s health and direction.
What are the different types of indices?
Let’s have a look at the different types of indices and what kind of possibilities they offer for traders.
Broad market indices
Broad market indices measure the performance of an entire stock market such as the S&P 500 index. This type of index helps investors to gauge the average movement of stocks within a market. In addition, it helps investors and traders who prefer diversification to allocate capital or speculate on the market at low cost by participating in the index derivatives market, index funds, or exchange-traded funds (ETFs).
Sector indices
Sector indices measure the average performance of a specific stock market sector. For instance, the Nasdaq-100 index tracks the performance of the top non-financial tech stocks on the Nasdaq exchange. A trader looking to speculate in the US tech sector may prefer this index to trading individual stocks as it helps optimise trading costs.
Investment style indices
There are indices that are categorised based on their investment styles. A style index tracks a group of financial assets that fit a certain investment type such as growth, value, or a blend of both. For instance, the Russell 1000 Growth Index tracks the performance of large-cap US stocks that exhibit growth characteristics.
Global market indices
Global market indices track the performance of stocks on a global scale. A typical example is the MSCI World Index which tracks the performance of large and mid-cap stocks from developed markets across the world.
Regional indices
Regional indices track the performance of top stocks within a certain geographical region. A good example is the EURO STOXX 50 cash index which tracks the performance of 50 top stocks from 11 countries within the Eurozone, or the DE30 which represents stocks from some of Germany’s largest companies.
Market capitalisation indices
Market capitalisation indices trail the performance of a group of stocks based on their respective market cap. For instance, the MSCI USA Large-Cap Index tracks the performance of US stocks with $10 billion or more in market capitalisation.
Volatility indices
Volatility indices measure the market’s expectation of future volatility. A popular example is the CBOE Volatility Index (VIX) which measures the expected market volatility of the S&P 500 index over the next 30 days.
Currency indices
A currency index measures the strength of a currency against a basket of other currencies to determine the currency’s strength. For instance, the dollar index (DXY) measures the strength of the US dollar against a basket of six other currencies comprising the euro, Japanese yen, British pound, Canadian dollar, Swedish krona, and Swiss franc.
In addition to these categories, there are other classifications such as bond indices and custom indices.`
How do you trade indices?
Investors seeking to own a proportionate stake in a stock market, sector, industry, region, or specified category often buy shares of the respective index fund of ETF.
Traders, on the other hand, are often interested in speculating on the index’s price to make a profit, rather than directly buying the underlying asset. In doing so, they would chose to trade index contracts for difference (CFDs) in the secondary market.
CFDs or contracts for difference on indices are derivative products that allow traders to speculate on the price movements of indices without owning the underlying asset. Traders can take a long or short position in the market, expecting the prices either to rise or fall.
Online brokers often offer index CFDs across a wide range of global markets, sectors, and industries to ensure that their customers can trade and take advantage of opportunities presented by these assets.
If the S&P 500 index is trading at a bid price of $4,557.93 and ask price of $4,558.02, a trader could buy a CFD representing the price of the index at $4,558.02 or sell it at $4,557.93. Thus capturing profits without directly owning shares of the index itself.
In index trading, traders can use leverage to control larger volumes with a smaller initial investment. For example, with a leverage of 1:400 the trader needs to provide only $1 to be able to open a position worth of $400. This can also be termed a 0.25% margin requirement. However, leverage works both ways so it should always be used with careful risk management.
Online brokers can also allow traders to trade fractional shares on indices with a minimum trade size of 0.01 of a share. Using the example above, it means that a trader can buy 0.01 shares of the S&P 500 index for $45.58.
Since index CFDs are leveraged, which involves borrowing capital to access bigger trades, they will likely require overnight swap rates. Swap is the interest paid, depending on the size of the position. This only applies when a trader holds a position past a trading day. Three-day swap rates are applied on Friday at market close to cover for the cost of holding trades over the weekend.
Depending on the market where the CFD index is listed, indices generally trade between 21 and 23 hours for five days a week including public holidays. When stock markets close on holidays, CFD indices can continue trading, like the forex market.
For investors and traders focusing on CFD indices, they will find stock performance trends, macroeconomic indicators, and news valuable sources of information to make educated decisions about what products to focus on.
What are the benefits and risks of trading CFD indices?
One of the main attractions of CFD index trading is the ability to use leverage, which allows you to control a larger position with a smaller amount of capital. While this can amplify profits, it also magnifies losses. If the market moves against you, the losses can exceed your initial investment. To reduce risk and limit potential losses, traders must have an effective risk management strategy and adhere to it.
Market risk is the risk of losses in positions arising from movements in market variables like prices and volatility. Market movements, especially sudden and unexpected ones, can lead to significant losses. Indices can be influenced by various factors, such as economic indicators, geopolitical events, and market sentiment.
Holding onto CFD index trades can lead to overnight fees and debited dividends in case you are holding a short position. It’s important to be aware of the possible costs and make sure you have enough funds in your trading account to keep positions open.

