Applying technical indicators
Learn about applying technical indicators to real-life trading situations and how to choose the right one for your strategy.
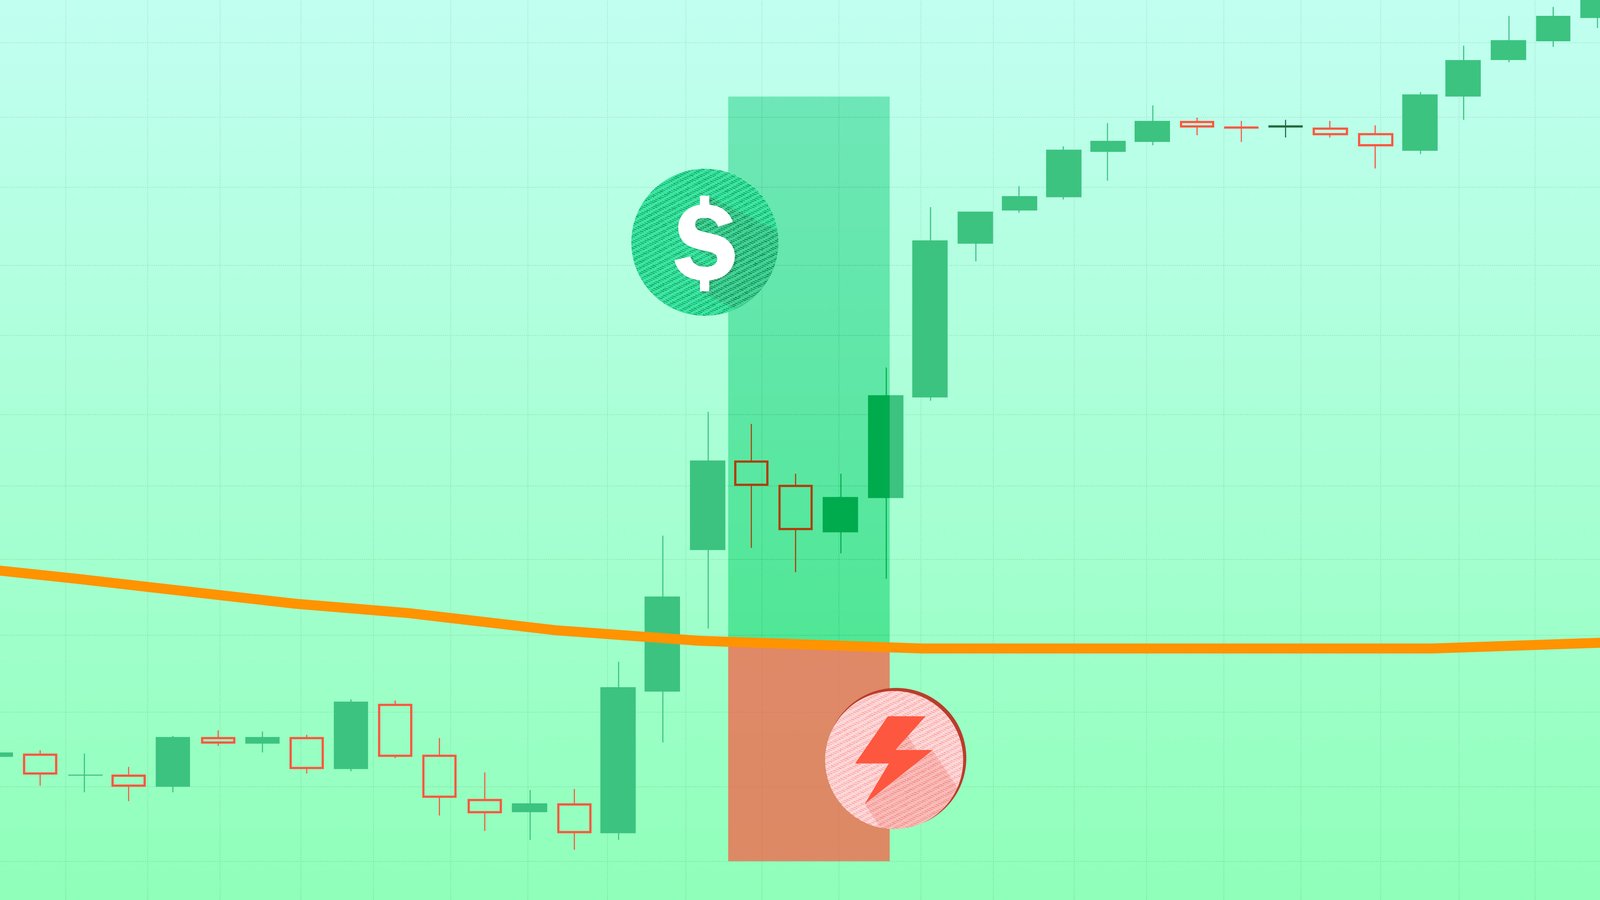
Technical indicators are essential tools for traders and knowing how to apply them to real-life scenarios can help you make more informed decisions about opening new positions
Different markets may require different sets of indicators, and using more than one technical indicator can offer a more complete picture of the market
It helps to consider the product and context when choosing the most appropriate indicator for your situation
You can find free technical indicators on your trading platform and use them to analyse any asset
How to use technical indicators in your trades
Technical indicators are mathematical patterns that use the historical price data of a financial asset to predict its future price action. They are a crucial part of technical analysis that focuses on analysing previous price movements to create predictions and generate trade ideas for the future.
It is essential for all traders to learn more about financial markets, instruments and to know how to analyse them. Without market analysis, traders will struggle to make informed decisions and that can potentially result in avoidable losses. An understanding of market analysis and technical analysis tools in real-world scenarios can help traders of all levels enhance their chances of success.
In our previous article about technical indicators, we introduced different kinds of analysis tools that form a trader’s toolkit. This article aims to expand on this and provide examples of practical applications of fore-mentioned technical indicators in various markets. Specific scenarios will illustrate how to apply technical indicators to the Nasdaq index, EUR/GBP currency pair, and Brent Crude oil instruments.
You can find technical indicators on your online trading platform, and you can choose which you’d like to apply to the asset you want to analyse and trade. Some technical indicators are plotted directly on the price chart, and they are referred to as overlays. Oscillators have their own separate window below the price chart. It is often helpful to use a series of indicators in combination to create a clearer view of market behaviour.
Nasdaq index and trend-following indicators
The Nasdaq Composite Index (or Nasdaq-100) is an American stock market index that includes almost all major stocks listed on the Nasdaq stock exchange based out of New York City. It is the most active stock trading venue in the US by volume, and follows NYSE as the second-largest American stock exchange by market capitalisation of shares traded as well.
Established in 1971, it’s weighted towards technology and internet-based companies like Apple, Amazon, and Microsoft. Due to its high volatility, wide market exposure and growth prospects, it's a popular choice among traders. Also, the dominance of tech stocks allows traders to capitalise on sector-specific trends in the technology sector.
How to apply trend-following indicators
Let’s imagine that you notice a strong upward trend. In this scenario, trend-following indicators like Simple Moving Averages (SMA) or MACD could prove invaluable for getting ahead of price trends.
SMA: A 50-day SMA that crosses above a 200-day SMA (Golden Cross) can be a strong signal to go long, as it often precedes a long-term uptrend.
MACD: If the MACD line crosses above the signal line, it's often a bullish sign. The signal line is a nine-period EMA (exponential moving average) of the MACD line and it’s plotted on top of the MACD line. This crossover can be seen as a cue to buy, especially when this is backed-up by other indicators (such as the SMA) or market news indicating an upward trend is forming.
EUR/GBP and mean-reverting strategies
Mean-reverting strategies describe the attempt to capture profits as the price of an asset returns to its average level (or “mean”). These can be popular when trading assets that have sufficient volumes to offer consistent data points that help predict trends.
Why EUR/GBP?
EUR/GBP is a minor currency pair representing the euro against the British pound. It's a popular pair in currency trading because of the economic closeness and interdependence between the Eurozone and the UK. The smooth flow of capital between these massive economies means that EUR/GBP often maintains a relative stable price action compared to other pairs.
They are both dominant reserve currencies, meaning there is a high volume of continuous trade, high liquidity, and thus, lower spreads.
How to apply mean-reverting indicators to EUR/GBP
Imagine the EUR/GBP currency pair has been range-bound for weeks, which implies mean-reverting indicators like the Relative Strength Index (RSI) or Bollinger Bands can be effective to decide the next move of an asset’s price.
RSI: If the RSI drops below 30, it’s a typical sign the asset is oversold. This is often a strong buy signal, especially in a ranging market.
Bollinger Bands: When the price touches the lower band, it could be an oversold condition. Coupling this with an RSI reading below 30 would add further evidence to buy.
Brent Crude oil contracts and volume-based indicators
Brent Crude is a major trading classification of crude oil sourced from the North Sea. The Brent Crude oil marker is used to price two-thirds of the world's internationally traded crude oil supplies.
Contracts vary from spot prices, futures contracts, and CFDs, with differing maturities. Some contracts tend to be more range-bound, especially those with shorter maturities due to frequent trading.
How to apply volume-based indicators to Brent Crude
Volume is a key factor in commodities markets. For Brent Crude contracts, indicators like On-Balance Volume (OBV), or a Volume Oscillator can provide critical insights for traders considering their next position.
OBV: If you notice a divergence between the OBV and price—e.g., price is going down, but OBV is going up—it may indicate an upcoming reversal.
Volume Oscillator: A rising Volume Oscillator above zero could confirm a bullish trend, signalling a good buying opportunity.
Choosing the right tools: Leading vs. lagging indicators
The art of trading lies in the application of knowledge. Understanding how to use technical indicators across various scenarios and market conditions can significantly elevate your trading game.
Some technical indicators are predictive tools that traders use with the aim of forecasting future price movements, while others can be used to confirm price trends when they are already happening.
Leading indicators, like the Stochastic Oscillator and Fibonacci retracements, are more effective when you're looking to catch a new trend before it fully forms. Lagging indicators, like Moving Averages or MACD, are better suited for confirming an existing trend. Depending on your risk-tolerance, you should experiment with both types of indicators on a trading demo and decipher which is best suited to your trading style.
While indicators are powerful tools, they are most effective when used in conjunction with a well-rounded trading strategy and sound risk management. Using risk management strategies and tools, such as stop loss orders, diversification, and position sizing, will also help you to protect your capital in case of unfavourable price movements.

