Introduction to technical indicators
Technical indicators provide easy-to-read statistical insights on financial assets. Read more to find out how they work.

Technical indicators use past data to provide generalised forecasts about future price action
Technical indicators can be categorised as trend-following, mean-reverting, price-based, volume-based, leading, or lagging
Learning about different indicators can help you to develop your understanding and application of these important trading tools
You can find technical indicators on your trading platform and they are free to use for all traders
What are technical indicators?
Sustainable trading is about gathering and interpreting information on financial assets in order to make more informed decisions. The two big areas that cover how most traders do this are fundamental and technical analysis.
Technical analysis focuses on analysing historical price data of an asset to make predictions of its future price movements. It can be conducted with candlestick charts, bar charts and trend lines, and patterns and trends can be established using this information.
Technical indicators provide the same information in a slightly different way. They are mathematical calculations based on the price, volume, or open interest of an asset. Displayed as patterns on charts, technical indicators serve as visual cues that help traders to analyse and predict market movements.
Technical indicators aren't one-size-fits-all tools; they come in different forms and serve various functions, each offering unique insights into market behaviour. Experimenting with different indicators will help you decide which ones work best for your trading style.
Where can you find technical indicators?
Whichever trading platform you are using, all of them offer price charts for the financial assets to analyse and a variety of indicators to use with the charts.
Some technical indicators are plotted directly on the price chart and these indicators are referred to as overlays. Oscillators have their own separate window below the price chart.
Overlays
Overlays are directly placed on the price chart and some traders feel they can provide a more immediate visual correlation with price movements. For this reason, overlays are particularly useful for traders looking to understand trends, support and resistance levels, and potential breakout or breakdown zones. Examples of overlay indicators include Simple Moving Average, Bollinger bands and Parabolic SAR.
Oscillators
In trading charts, oscillators are typically found in a separate window below the main price chart, making it easy to compare their movements with price action. These technical indicators are helpful for assessing the momentum of an asset’s price and identifying overbought or oversold conditions. Oscillators move within a specific range, usually between 0 and 100, offering a straightforward way to assess the market. Examples of oscillators include Relative Strength Index (RSI), Moving Average Convergence Divergence (MACD) and Stochastic Oscillator.
What do technical indicators tell about price action?
More important than their position on your chart, is the information technical indicators provide - both in isolation and combination with each other.
By themselves, technical indicators can provide information on price history and prediction, trading volumes, confirmation of trends and several different variables which can support more informed trading.
Below, we’ll look at some standard categories for technical indicators.
Trend following vs mean-reverting
Trend indicators are designed to identify and capitalise on existing price trends. They help traders to ‘ride the wave' in either an upward or downward market trend. These indicators are especially useful in strong trending markets and less effective in sideways, ranging, or choppy markets.
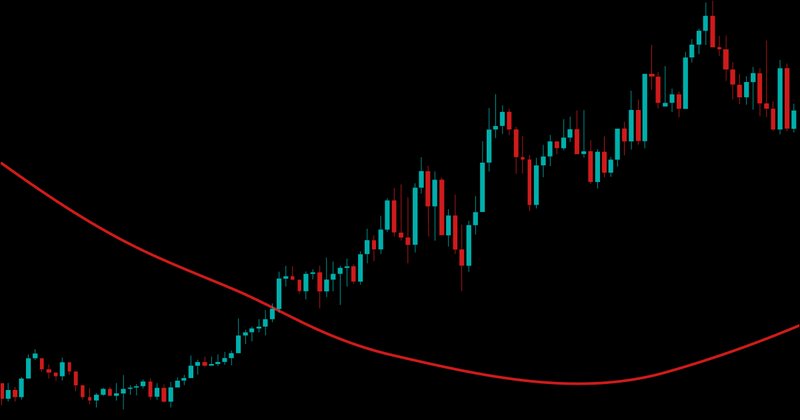
In the example below, you can see how a simple moving average smooths out price data to create a line that traders can use to identify the direction of the trend. A rising moving average typically confirms an uptrend, while a falling one indicates a downtrend.
In choppy or range-bound markets, the asset’s price is more likely to bounce between more established price levels, for example at hard support and resistance levels. Having information on when the asset is likely to get to its average (mean) price can inform a trader’s decision on when to buy or sell. When prices are above the mean the asset may be considered overbought and when they are below, it may be oversold. This information can provide trade ideas for when to enter and exit positions or whether to go for a long or short position.
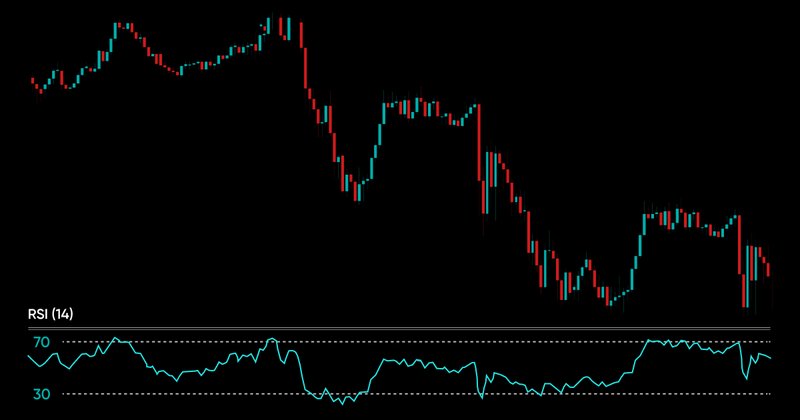
See below how the RSI can indicate where an asset is overbought (over 70) and oversold (below 30), and the relative impact on the candlestick pattern in the main price chart window - notice how periods of overselling are followed by upticks in price, and vice-versa.
Price vs volume-based indicators
As the names suggest, certain technical indicators provide information regarding the past price movements, whilst others are providing insights on the volume of trade that is taken place.
The examples above for RSI and SMA are centred around the price of the asset and how that price is either trending or its relative level in comparison to a mean.
Volume-based indicators, like a volume oscillator, analyse the amount of a security traded over a specific period. Because high trading volumes can often be an indicator of price changes, volume indicators might help to identify trend reversals.
Leading vs lagging
Leading indicators are predictive tools that traders and investors use to forecast future price movements in the financial markets. Unlike lagging indicators, which confirm trends after they have already begun, leading indicators aim to anticipate price changes before they occur. They are considered forward-looking because they generate signals that suggest a change in price direction is more likely to happen soon.
A stochastic oscillator is an example of a leading indicator. Like RSI, the stochastic oscillator ranges between 0 and 100 and identifies overbought and oversold levels. However, it also compares a particular closing price to a range of prices over a certain period which can be helpful in trend analysis.
Fibonacci Retracements are also considered leading indicators, illustrated as horizontal lines showing potential reversal levels based on the Fibonacci sequence (where the next number in a sequence is the sum of the two numbers before it, i.e. 0, 1, 1, 2, 3, 5). The Fibonacci sequence is an application of complex mathematical theory, which shows itself in natural patterns and orders - sometimes called the ‘golden ration’ and popularly shown in a spiral shape, such as in seashells. Applying these can provide insights for entry and exit strategies as market trends can evolve in a similar progression.
Lagging technical indicators are tools used in financial markets to confirm existing price trends rather than predict future activity. Unlike leading indicators, which attempt to forecast price changes, lagging indicators provide signals after the trend has already been established. This makes them ideal for traders who prefer to confirm the sustainability of a trend before taking a position. Examples of lagging indicators include the previously mentioned Bollinger bands and MACD indicators.
Learn how to use technical indicators
It’s important to understand how technical indicators are more applicable in certain markets and how they can be used in different trading strategies.
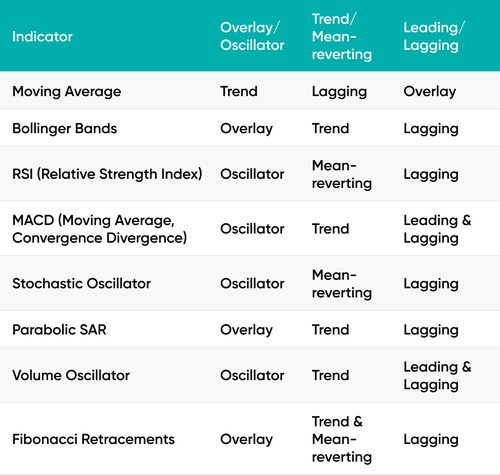
Here is a table to help you categorise their main features.
Technical indicators can be found on your trading platform such as MetaTrader 4 or MetaTrader 5, and traders have free access to all these tools. You can choose to use of the indicators to analyse opportunities in the market or apply several indicators to one price chart. With practice, you will find the right indicators or combinations that suit your personal trading strategy.
Opening a risk-free demo account is a good way to learn about more technical indicators and how to use them to place your trades. With a demo account, you get access to real markets with virtual funds so you can apply the information provided by the indicators, such as timings for market entry and exit, to your practice trades without putting your capital at risk.


