British pound falls after UK unemployment rate exceeds forecasts
The British pound depreciated slightly as the UK unemployment rate climbed to 5.0%, compounding the policy dilemmas facing the Bank of England (BoE) amidst a 3.3% headline inflation rate and escalating Middle East energy risks.

The UK unemployment rate unexpectedly rose to 5.0% in the three months to March, maintaining a three-year structural upward trend that complicates the central bank’s path toward monetary easing.
Net employment growth reached 148,000, comfortably beating forecasts. However, persistent 3.3% inflation and high energy costs driven by geopolitical frictions continue to limit the scope for policy adjustments.
The GBP/USD pair fell 0.23% amid ongoing economic and political pressures in the United Kingdom.
Pound sterling declines as UK unemployment rises above expectations
According to data released by the Office for National Statistics (ONS), the UK unemployment rate increased from 4.9% to 5.0% in the three months to March, overshooting analysts' estimates of a flat reading. Conversely, the accompanying employment change figure revealed the addition of 148,000 positions, substantially outperforming market forecasts of a 107,000 increase.
While the ONS labour market report presented mixed data points, the underlying upward trend in the headline unemployment rate has persisted for three years, intensifying the policy pressures acting upon the Bank of England. The BoE currently faces dual constraints: signs of economic cooling in key industrial sectors alongside stubborn inflationary pressures. The headline consumer price index remains elevated at 3.3%, aggravated by a volatile geopolitical landscape in the Middle East, where the unresolved US–Israel–Iran conflict continues to support higher global energy prices.
Reflecting these structural concerns, the British pound depreciated by 0.23% against the US dollar to trade at $1.3395, remaining bound within a consolidation pattern that has signalled broader market uncertainty over recent months.
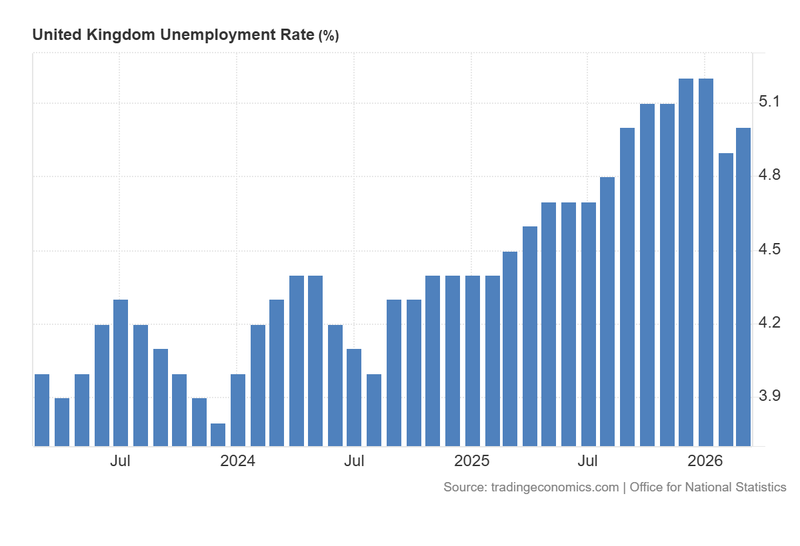
Figure 1. United Kingdom Unemployment Rate (2023–2026). Source: Data from the Office for National Statistics; Figure obtained from Trading Economics.
Technical analysis of the GBP/USD pair
From a technical perspective, the GBP/USD pair continues to trade within the structural boundaries of a well-defined long-term bullish channel. However, the immediate price action points toward a near-term transition into a consolidative or corrective phase:
- Trend Context: Although the pair maintains a long-term bullish trajectory characterised by a series of higher highs and higher lows, it is currently executing a significant downside breach of its 50, 100, and 200-period Simple Moving Averages (SMAs).
- Resistance Levels: Should the pair stage a recovery and breach immediate dynamic resistance at 1.3500—which currently aligns with a descending trendline ceiling—the next major technical level resides at the structural horizontal resistance of 1.3670. A decisive daily close above this threshold would invalidate the corrective outlook, signalling a resumption of the primary bullish trend.
- Support Levels: If the short-term bearish momentum persists, the critical floor to monitor is identified at 1.3180. This level represents a key convergence zone between structural support and the lower parameter of the multi-year ascending chart pattern. A decisive break below 1.3180 would significantly increase the probability of a deeper market correction.
- Momentum Indicators: The Moving Average Convergence Divergence (MACD) has confirmed a bearish crossover, illustrating that distribution and downward pressure may intensify in the near term. Similarly, the Relative Strength Index (RSI) continues to trend lower. As the indicator has yet to reach oversold territory, momentum remains within neutral levels, suggesting there is still room for further downside movement.
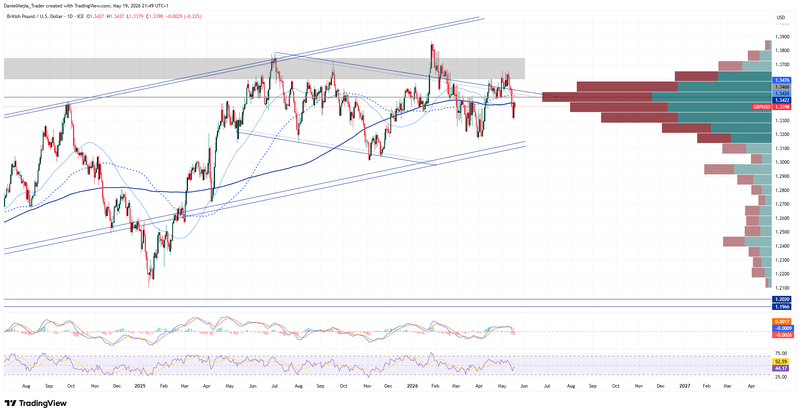
Figure 2. GBP/USD pair (2024–2026). Source: Data from the Intercontinental Exchange (ICE); own analysis conducted via TradingView.


