Euro retreats as strong US PPI and weak industrial output boost dollar
The euro faced renewed downward pressure against the US dollar following a sharp 2.1% contraction in Eurozone industrial production. In contrast, the US Producer Price Index (PPI) surged to 6% year-on-year (YoY), propelled by escalating gasoline costs linked to heightened geopolitical tensions in the Middle East.

Euro Zone industrial production declined by 2.1% YoY, exceeding market forecasts and marking a third consecutive month of contraction as core economies in the region grapple with structural growth challenges.
The US PPI rose by 1.4% month-on-month in April, reaching a 6% annual rate—its highest level since 2022—driven primarily by a 15.6% spike in gasoline prices.
The EUR/USD pair depreciated as investors reacted to the widening gap between stagnant European productivity and persistent inflationary risks in the United States.
Euro Area industrial production underperforms market expectations while US PPI climbs sharply
According to data released by Eurostat, industrial production in the Eurozone decreased by 2.1% on a year-on-year (YoY) basis, falling short of the 1.7% decline anticipated by analysts. This marks the third consecutive month of contraction, with output levels reaching their lowest point since September 2024. The Euro Area continues to contend with significant productivity and growth headwinds, which remain particularly pronounced in major economies such as Germany.
Concurrently, figures from the US Bureau of Labour Statistics (BLS) revealed that the Producer Price Index (PPI) surged by 1.4% in April on a monthly basis, significantly exceeding the consensus forecast of 0.5%. Consequently, the YoY PPI accelerated from 4.3% in March to 6% in April—the highest annual rate recorded since December 2022. The BLS report indicates that this prominent increase is primarily attributable to a 15.6% monthly jump in gasoline prices, a direct consequence of the escalating US–Israel–Iran conflict in the Middle East.
As a result of this divergence between weak Eurozone industrial data and mounting inflationary pressures in the US, the euro weakened against the greenback. The EUR/USD pair depreciated by 0.21%, trading at $1.1713.
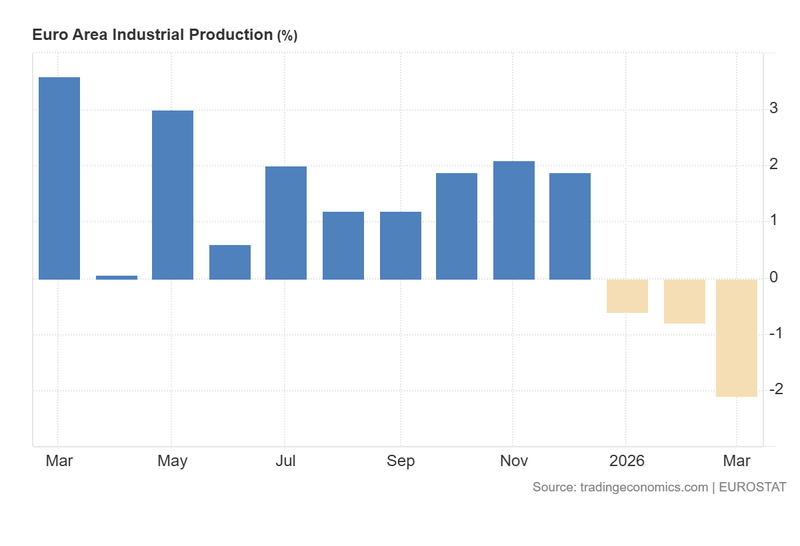
Figure 1. Euro Area Industrial Production (2025–2026). Source: Data from Eurostat; Figure obtained from Trading Economics.
Technical analysis of the EUR/USD pair
From a technical perspective, the EUR/USD pair is currently characterised by a period of short-term consolidation. Key observations include:
- Trend Context: Over recent months, the pair has remained range-bound, reflecting a state of market indecision. Notably, price action continues to respect the 50, 100, and 200-day Simple Moving Averages (SMAs), which are currently functioning as a significant support zone.
- Resistance Levels: Should the long-term structural resistance at $1.1850 be breached, the next major technical ceiling is identified at the $1.2270 structural level. A decisive breakout above this point would suggest the potential for a sustained extension toward higher valuations.
- Support Levels: If the $1.1680 support level is compromised—a point where the 50, 100, and 200-day SMAs converge—the next relevant floor is situated at $1.1470, which marks the lower boundary of the current consolidation range. A breach of the $1.1470 zone would significantly increase the probability of a deeper market correction.
- Momentum Indicators: Both the Moving Average Convergence Divergence (MACD) and the Relative Strength Index (RSI) are trading near their neutral mid-points, suggesting a lack of predominant directional momentum. Consequently, fundamental economic developments are likely to be the primary determinants of the market’s prevailing trend in the forthcoming period.
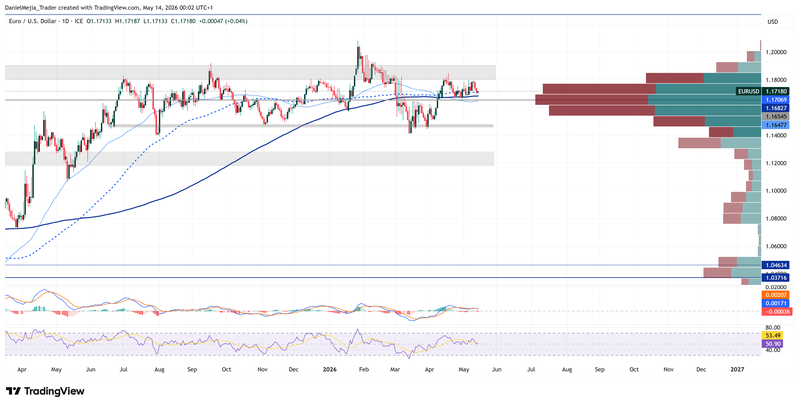
Figure 2. EUR/USD pair (2025–2026). Source: Data from the Intercontinental Exchange (ICE); Own analysis conducted via TradingView.


