Bitcoin down 22% in Q1 — worst start since 2018 bear market?
Bitcoin is on track for its weakest first quarter in years, while Ethereum faces renewed sell-side pressure as on-chain data turns cautious.

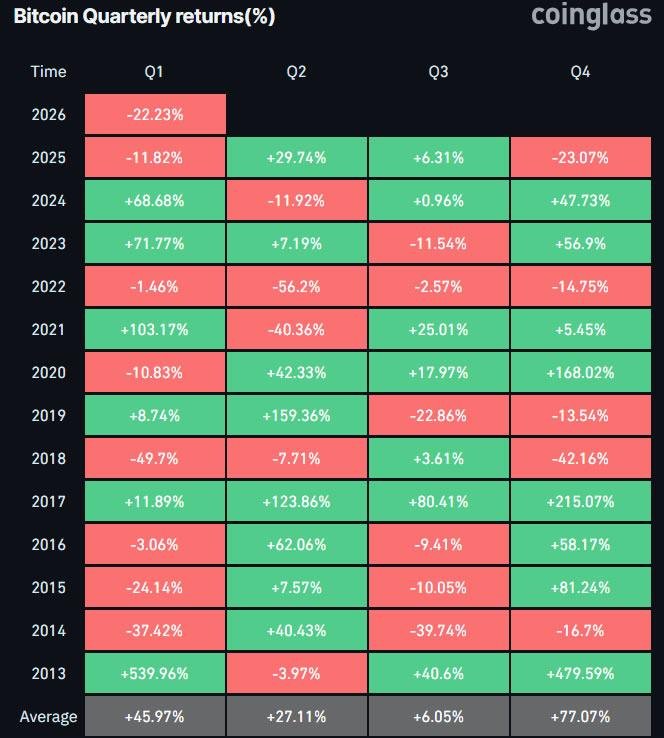
Bitcoin has fallen 22.3% since the start of the year
Could mark its worst Q1 performance since 2018
Consecutive red January and February would be a first for BTC
Ethereum slips below $2,000 as exchange inflows and derivatives turn bearish
Bitcoin heads toward worst Q1 in eight years
Bitcoin may be staring at its weakest first-quarter performance since the 2018 bear market, with the asset already down more than 22% year-to-date.
Source: Coinglass
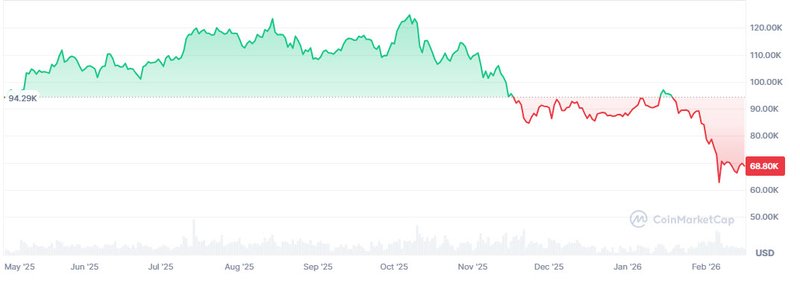
Bitcoin began the year trading near $87,700 but has since declined roughly $20,000, recently touching lows around $68,000. If losses persist through March, this would mark the worst Q1 showing since 2018, when Bitcoin plunged nearly 50% during the peak of that cycle’s downturn.
Source: Coinmarketcap
Historically, the first quarter has often been volatile for Bitcoin. The asset has posted negative Q1 returns in seven of the past thirteen years. Recent examples include a decline of 11.8% in 2025 and 10.8% in 2020, though neither compares to the dramatic 49.7% collapse seen in early 2018.
Consecutive red months raise concerns
Bitcoin is also on pace for something it has never experienced before: back-to-back losses in January and February. The asset dropped 10.2% in January and is currently down more than 13% in February.
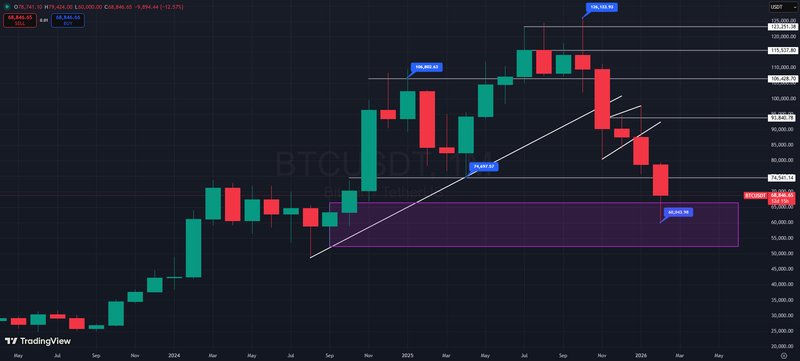
To avoid closing February in the red, Bitcoin would need to reclaim the $80,000 level — a significant recovery from current prices.
Source: TradingView
Despite the sharp correction, some analysts argue the move reflects a cyclical reset rather than structural weakness. Bitcoin has historically endured deep first-quarter drawdowns before staging stronger recoveries later in the year, particularly during halving cycles and periods of rising institutional adoption.
Currently, Bitcoin has recorded five consecutive weeks of losses, recently trading near $68,670, according to market data. Whether this downturn evolves into a prolonged bearish phase or stabilizes into consolidation remains the central question for investors.
Ethereum slips below $2,000 as on-chain data turns bearish
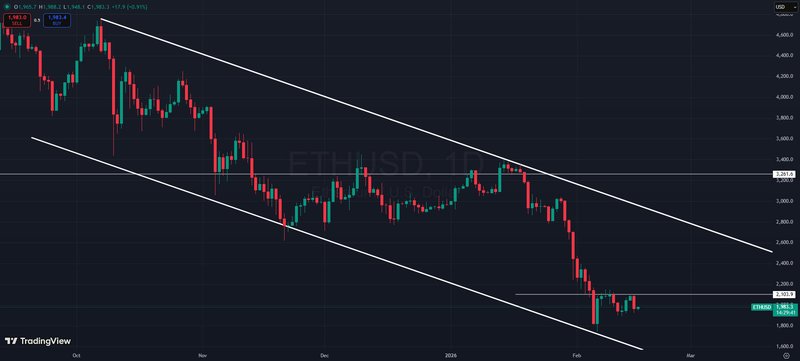
While Bitcoin struggles, Ethereum is facing mounting technical and on-chain pressure after slipping below the key $2,000 level.
The decline unfolded gradually rather than through panic selling. Liquidity thinned across sessions, recovery attempts stalled, and price eventually broke below support — reflecting positioning shifts more than sudden market shock.
Large holder transfer boosts exchange supply
On-chain data shows that a major wallet associated with Garrett Jin transferred approximately 261,000 ETH — worth roughly $545 million. While exchange deposits do not automatically signal immediate selling, they increase available liquidity and often precede hedging or distribution activity.
The timing raised eyebrows, as the transfer occurred while Ethereum was struggling to hold the $2,100–$2,200 range. Shortly after, upside momentum faded and each rebound attempt stalled near $2,100 — a pattern consistent with distribution rather than accumulation.
Derivatives positioning shifts toward sellers
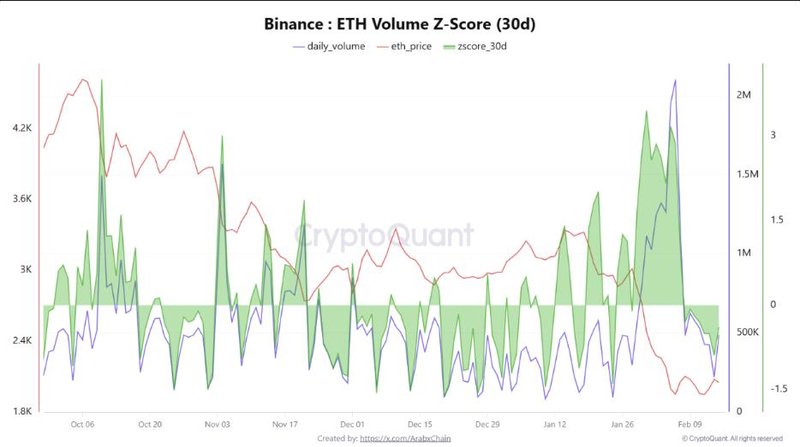
Market metrics suggest cooling demand rather than outright capitulation. Trading volume has dipped below its 30-day average, signaling reduced participation from aggressive buyers.
Source: CryptoQuant
More notably, the taker buy/sell ratio has fallen below 1.0, indicating that market sell orders are outweighing market buys. This typically reflects growing short positioning or hedging activity in derivatives markets, often a precursor to heightened volatility.
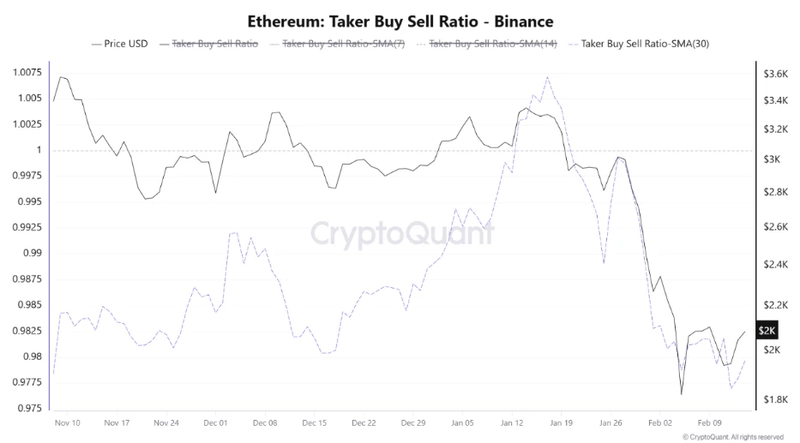
Source: CryptoQuant
Technical structure shows consolidation after breakdown
After losing prior range support near $2,500, Ethereum did not accelerate sharply lower. Instead, price transitioned into a tight consolidation band below $2,000.
The former support zone between $2,020 and $2,080 has flipped into resistance, with repeated rejection confirming that traders view the area as supply. Short-term moving averages are compressing above price and acting as dynamic resistance, limiting recovery attempts.
A decisive close back above $2,100 would neutralize the breakdown structure and potentially shift momentum bullish. Conversely, a break below $1,800 could expose Ethereum to further downside toward the $1,500 region in coming sessions.
Correction or deeper downturn?
For both Bitcoin and Ethereum, the current environment reflects caution rather than panic. Macro uncertainty, profit-taking, and shifting derivatives positioning are driving the pullback.
History suggests that first-quarter weakness does not always dictate full-year performance. However, without renewed demand or stronger institutional flows, the crypto market may remain vulnerable to further volatility in the weeks ahead.


