Strong industrial demand supports silver in 2026
Silver’s industrial demand is poised to remain a central force in the market as 2026 unfolds, with structural drivers such as energy transition and technology use continuing to offset broader cyclical softness.

Global solar PV capacity is forecast to reach 665 GW in 2026.
Ratio could drift toward 50:1 by year-end 2026.
The main target expected at $120 per ounce.
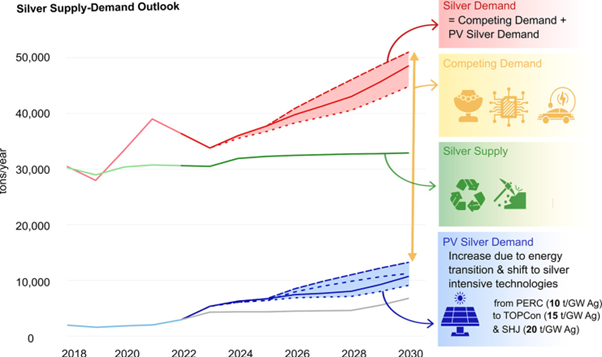
Industrial demand remains a key structural support
Industrial use reached 680 million ounces (Moz) in 2024, accounting for around 60% of total global silver demand. Demand is expected to remain near this level in 2025, at 677–682 Moz, keeping industrial consumption close to record highs.
Looking ahead, the energy transition remains a key source of industrial demand growth. Global solar PV capacity is forecast to reach 665 GW in 2026, supporting around 120–125 Moz of silver demand from solar panels alone. Electric vehicle (EV) production, forecast at 14–15 million units, is expected to add a further 70–75 Moz, while grid upgrades and data centre infrastructure could contribute an additional 15–20 Moz.
Supply remains constrained because over 70% of silver is produced as a by-product, limiting how quickly output can increase. Meanwhile, ETF inflows of 15–20 Moz in 2025 have further tightened available metal. Together, these factors suggest industrial demand will remain near record levels, reinforcing market tightness even as broader economic activity moderates.
Overall, current data suggest industrial demand will remain a structural anchor through 2026–27, supporting silver consumption even as broader economic activity slows.
Source: ars.els
Gold–silver ratio signals further compression
The gold–silver ratio has compressed to around 55–65:1, down sharply from its peak above 100 in 2025. If silver continues to outperform gold on structural demand, the ratio could finish 2026 closer to its long-term median of 50–60.
Silver’s relative outperformance has been supported by persistent deficits, strong industrial demand and rising ETF inflows, narrowing the ratio even as gold remains supported by safe-haven and central bank flows.
ETF dynamics also matter. Silver-linked ETFs saw substantial net inflows in 2025, outpacing many gold funds and tightening available supply. At the same time, gold ETFs remain large, supported by reserve diversification and hedging demand, keeping gold’s premium elevated.
If silver’s supply deficits persist and industrial demand remains stronger than gold’s, the ratio could drift toward 50:1 by year-end 2026.
However, headline-driven volatility and periodic fund rebalancing may still trigger short-term reversals.
Source: Trading View
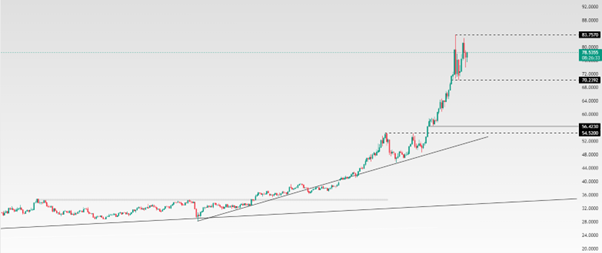
Silver technical outlook
Silver continues to trade within an upward channel after rallying past $94 per ounce in early 2026. Short-term support holds near $80–$84, while resistance is around $92.70–$94.
Momentum indicators are mixed, with the Relative Strength Index (RSI) showing moderate buying pressure, while multi-period moving averages suggest potential short-term consolidation.
The medium-term trend remains bullish, supported by structural industrial demand, with the main target expected at $120 per ounce, as long as trading stays above the support level.
A sustained break below the lower channel support could open the way for a move toward $72–$78, aligning with the rising 50-day moving average. Overall, the medium-term bias remains bullish, driven by structural industrial demand, although short-term corrective risks persist as the market digests recent gains.
Source: Trading View


