Analysis of the inverted yield curve in the US bond market
This article analyses, from a general perspective, the phenomenon of the inverted yield curve in US bond markets. It also examines the relationship between yield-curve inversions and labour-market outcomes. To reach the conclusions described, a historical framework is assessed with the aim of contrasting past episodes with the current economic situation of the United States.

The inverted yield curve phenomenon occurs when short-term Treasury bonds offer a higher yield than long-term bonds.
Over the past 35 years, the inverted yield curve has occurred in four periods in US bond markets (1989, 2000, 2006-2007, and 2022-2024).
Historical analysis shows that, after the yield curve inverts, the unemployment rate has tended to increase significantly.
While employment indicators have shown weakness in recent quarters, the unemployment rate has risen only 26% (90 bps) from its 2023 low.
What is the inverted yield curve? Fundamentals and theory
The inverted yield curve is a financial phenomenon in which short-term bond yields exceed long-term yields. The sovereign benchmarks most commonly used to represent the short and long term are US Treasury securities with maturities of two and ten years, respectively, though many studies also consider other maturity pairs. Under normal conditions, long-dated bonds yield more than short-dated bonds because investors demand a higher term premium to hold debt over a longer horizon, given the greater economic and political uncertainty inherent in the long term.
The inversion is considered important because it has been one of the better indicators for signalling US recessions. It also serves as a useful barometer of economic conditions for investors and for the Federal Reserve (Fed). If, at any point, the two-year Treasury yields more than the ten-year, the curve is inverted. However, analysis should not stop at whether an inversion exists; it is also necessary to consider the duration of the inversion and the macroeconomic context in which it occurs.
In terms of recession risk, a yield curve inversion followed by flattening and eventual normalisation—where the long-term premium exceeds the short-term— is often interpreted as a signal that the economy is heading towards a recession or, at minimum, a period of stagnation. The logic is that the central bank—having tightened policy to contain inflation—would reduce rates only if it judges that its restrictive stance has materially affected activity. In addition, inversions can weigh on activity via the banking system: by compressing the net interest margin (the difference between rates on longer-term loans and shorter-term funding costs), they reduce incentives to extend credit. This discourages lending to both consumption and investment, dampening overall economic dynamics.
That said, while inversions have preceded many recessions, they do not imply an economic collapse every time they occur. Continuous study of the curve has enabled investors and the Fed to take precautionary decisions; the indicator remains an important ally for analysing the economy and debt markets.
Historical analysis of the yield curve in the US bond market
Over the last 35 years, the yield curve has inverted on four periods: 1989, 2000, 2006-2007, and 2022-2024 (see graph below). In 1989, the curve was inverted for 11 months, followed by 9 months of flattening and then normalisation. In 2000, the curve inverted for 12 months and then normalised without a distinct flattening phase. In 2006–2007, the curve inverted (at a relatively modest depth) for 15 months, flattened for 2 months, and then normalised. In 2022–2024, the curve inverted for 24 months—the longest in the period under review—and at one of the most pronounced depths in terms of the two-year/ten-year spread. After inversion, the curve flattened for around 5 months and is currently normalised.
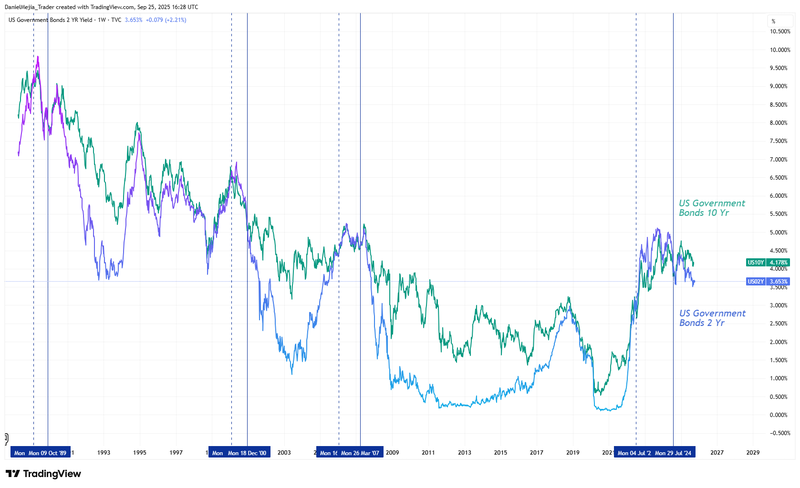
Source: Own analysis conducted on Trading View (September 2025). Data from: US Department of the Treasury.
According to the chart below provided by the Federal Reserve Bank of St. Louis, the US economy experienced recessionary or contractionary impacts months after previous inversions. However, in the current context, roughly 12 months have elapsed since the end of the inversion and the economy still shows signs of strength.
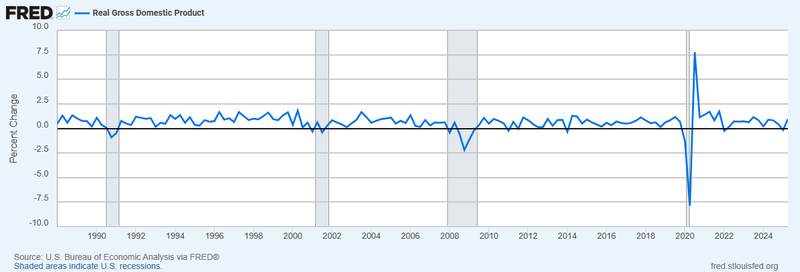
Source: US Bureau of Economic Analysis, Real Gross Domestic Product, retrieved from FRED, Federal Reserve Bank of St. Louis; 27 September 2025.
Implications for the labour market following a yield-curve inversion
At present, the US economy continues to show resilience in production and consumption. Gross domestic product (GDP), for instance, has expanded steadily, recording a quarterly growth rate of 3.8% in Q2 2025. This corresponds to a year-on-year increase of 2.1%, representing a stronger performance than that of several major Western economies, including Japan, the United Kingdom, France, and Germany. Even so, according to Fed Chair Jerome Powell, the country faces economic uncertainty because inflation has not been fully contained and employment is beginning to show signs of weakness. Employment may be a key parameter for the central bank to begin monetary easing if deterioration persists.
Historically, the unemployment rate—one of the Fed’s core decision variables—has displayed a notable pattern after inversions. As illustrated in the following graph, once the inversion episode ends, the unemployment rate typically rises significantly in terms of its growth rate. Following the 1989 inversion, the rate increased by 50% (260 bps) over approximately 2.6 years; after the 2000 inversion, by about 61% (240 bps) over 2.3 years; and after the 2007 inversion, by 127% (558 bps) over roughly 2.4 years. Currently, 12 months have passed since the 2024 inversion ended; however, the unemployment rate has not shifted as markedly as in prior episodes and remains historically low at 4.3%.
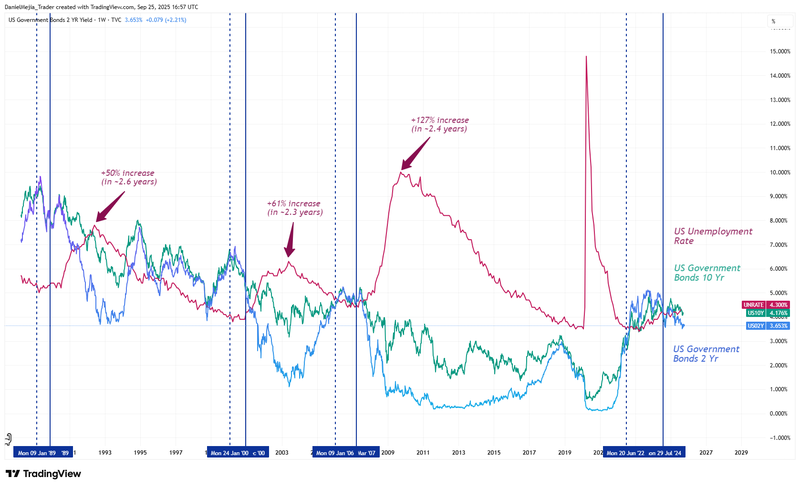
Source: Own analysis conducted on Trading View (September 2025). Data from: Bureau of Labor Statistics and US Department of the Treasury.
Current employment outlook in the US
Two of the most important indicators—non-farm payrolls and the unemployment rate—are already showing some weakness. Non-farm payroll growth has slowed considerably over the past three years.
Meanwhile, the unemployment rate has been rising from its 2023 trough of 3.4% (see chart below). Even so, the increase has been less pronounced than in past cycles: from its 2023 low, the rate is up approximately 26% (90 bps), now at 4.3%—a level not considered critical in a historical context.
Accordingly, employment indicators presently sit in a zone of uncertainty: they are beginning to reflect some fragility that keeps the Fed cautious, yet they have not progressed to levels typically associated with recession or stagnation.
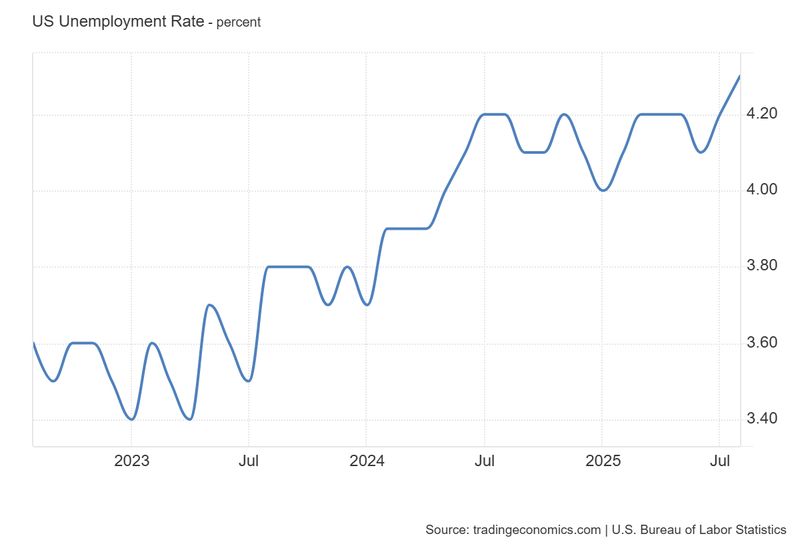
Source: Image obtained from Trading Economics (September 2025). Data from: Bureau of Labor Statistics.
Conclusion
The inverted yield curve is a key indicator in US debt markets, with a strong track record of signalling recession scenarios. It also serves as a barometer for the Federal Reserve and investors. The historical record shows that, after inversions of the two-year/ten-year spread, the US economy has often weakened, with a gradual rise in the unemployment rate among the most prominent symptoms.
At present, the Federal Reserve remains cautious about forthcoming policy moves, given perceived stagflation risks arising from a potential inflation rebound and the possibility of negative effects on employment indicators.


