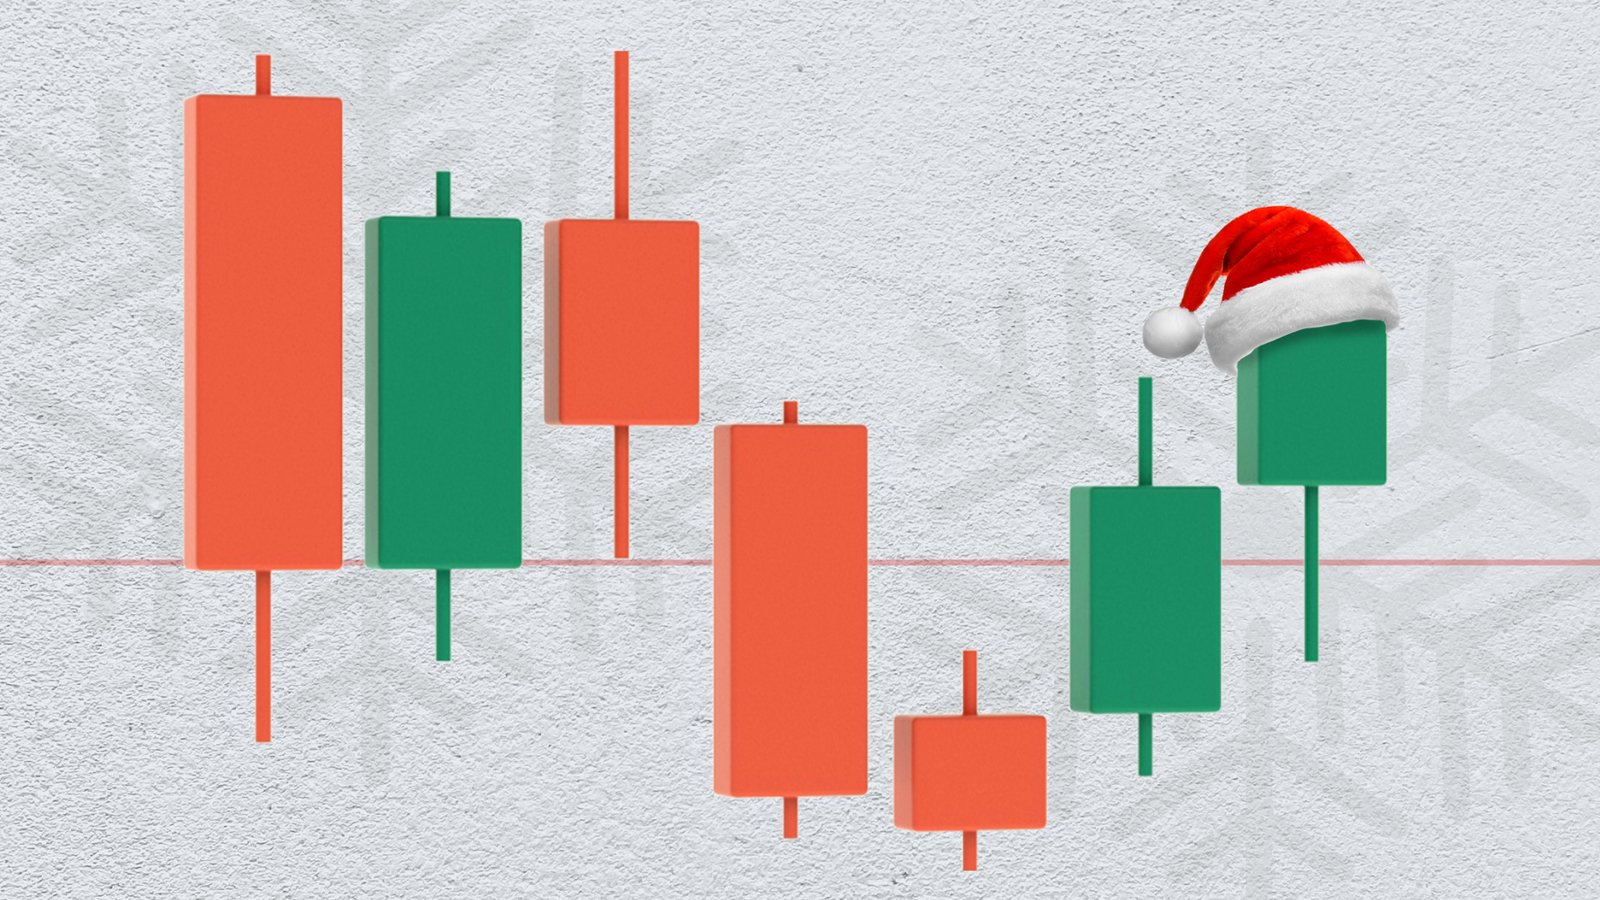
What is a Santa Claus rally?
Understanding the Santa Claus rally in financial markets

A Santa Claus rally signifies a positive surge in stock prices during December, driven by increased optimism and holiday sentiment among investors.
Coined by Yale Hirsch in 1972, the rally historically occurred in the last five trading days of the year and the first two days of January, manifesting about 79.2% of the time over a 70-year span.
While anticipated annually, the Santa Claus rally's occurrence is not guaranteed, with recent years showing mixed patterns.
A Santa Claus rally refers to a phenomenon in financial markets where there is a positive upward movement in stock prices during the month of December, typically around Christmas and towards the end of the year (A calendar effect). This rally is often due to increased optimism and positive sentiment among investors as the holiday season approaches.
The exact causes of a Santa Claus rally are debated, and various factors may contribute, including holiday retail sales, positive expectations for the coming year, and a general sense of goodwill. For some, January represents an opportune time to initiate an investment program or follow through on a New Year's resolution related to their financial strategies.
It's worth noting that while the Santa Claus rally is a recognized market pattern, it is not a guaranteed occurrence, and market behavior can be influenced by a wide range of unpredictable factors.
Historically
In 1972, Yale Hirsch, the originator of the Stock Trader’s Almanac, coined the term "Santa Claus Rally." He specifically identified the last five trading days of the year and the first two trading days in January as the designated timeframe for the rally.
Historically, these seven days have demonstrated a higher occurrence of elevated stock prices, occurring approximately 79.2% of the time, as indicated by the S&P 500. Over a span of 70 years, spanning from 1950 to 2020, the Stock Trader’s Almanac compiled data revealing that the Santa Claus rally manifested 57 times, coinciding with an average growth of 1.3% in the S&P 500.
Analyzing a 20-year span of Standard & Poor's 500 performance in the week leading up to December 25, from 2002 to 2021, reveals limited evidence of a distinctive Santa Claus rally. According to the S&P 500 data during this period, there were 13 weeks characterized by positive returns, five with negative returns, and two with no change.
These findings suggest a mixed and fluctuating pattern rather than a consistent and pronounced Santa Claus rally effect during this specific timeframe.
Cyclical Trends
Markets consistently engage in the analysis of whether a Santa Claus rally is likely to occur at the close of each year. This anticipation involves assessing various factors, such as historical market trends, economic indicators, and investor sentiment, to gauge the potential for a year-end surge in stock prices. Traders and investors often scrutinize a range of variables to make informed predictions about market behavior during the holiday season, although it's important to note that market movements can be influenced by a multitude of factors and predicting them with certainty is challenging.
Traders carefully observe cyclical trends and seek to capitalize on historical patterns, but it remains a somewhat unpredictable endeavor, and the Santa Claus rally is no exception to this rule. Investors prudently manage their risk and potential rewards by employing position-sizing strategies and implementing stop orders to mitigate losses if their positions move unfavorably.
Happiness on Wall Street


