Alphabet nears record highs ahead of earnings: Financial and technical analysis
Alphabet’s shares currently exhibit a prominent bullish trend, with price action trading in close proximity to historical record highs. This consistent performance is underpinned by robust fundamental drivers, including sustained growth in revenue, net income, and total assets, while leverage risk remains well-contained. However, short-term momentum indicators suggest that the stock has entered overbought territory.

Alphabet is scheduled to release its Q4 2025 financial results on Wednesday, 4 February, with analysts anticipating year-on-year (YoY) growth of 15% in revenue and 24% in earnings per share (EPS).
The company maintains a consistent upward trajectory in revenue and asset accumulation, supported by a conservative debt-to-equity ratio which stood at 6% in the most recent quarter.
While the long-term trend remains decisively bullish, momentum oscillators indicate overbought conditions in the short term, signalling a possible for temporary price stabilisation.
Alphabet’s shares trade near record highs ahead of earnings
Alphabet Inc. is set to release its Q4 2025 financial results following the market close on Wednesday, 4 February. Market consensus estimates currently project total revenue of $111.33 billion and earnings per share (EPS) of $2.63. These forecasts imply a year-on-year (YoY) increase of 15% in total revenue and a 24% rise in EPS. Although these growth figures represent strong performance, they sit slightly below the historical averages observed during the analysed period.
Financial analysis of Alphabet Inc.
From a fundamental perspective, Figure 1 demonstrates that Alphabet has sustained a long-term upward trajectory in both total revenue and net income. The company’s average revenue growth rate is recorded at 17%, with a particularly consistent acceleration observed since Q2 2023.
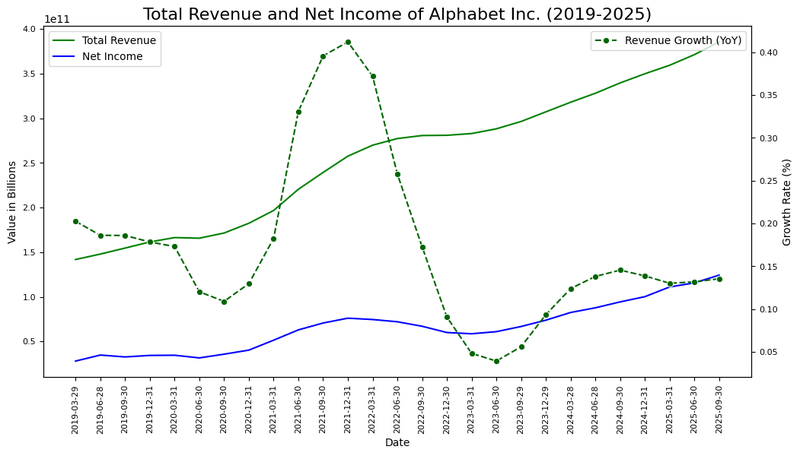
Figure 1. Total revenue, net income, and respective growth rates of Alphabet Inc. (2019–2025). Source: Own analysis using data from the Nasdaq Exchange.
Additionally, as illustrated in Figure 2, Alphabet’s net margin maintains a healthy upward trend. The net margin has averaged approximately 25% and has shown steady improvement throughout the period under review.
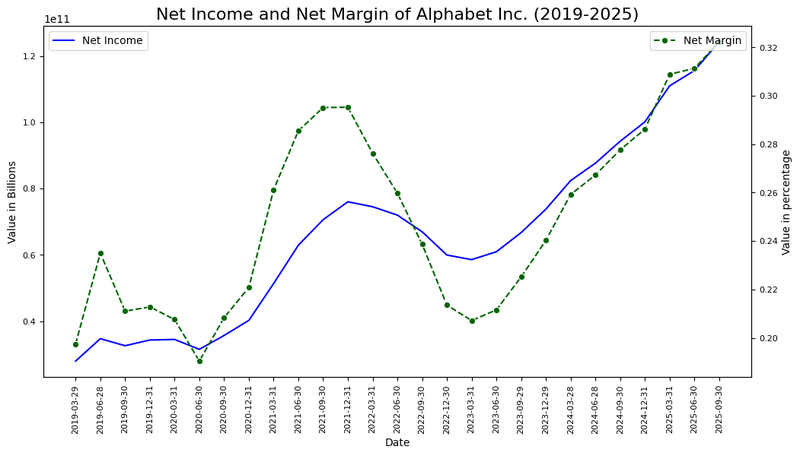
Figure 2. Net margin trend and profitability analysis of Alphabet Inc. (2019–2025). Source: Own analysis using data from the Nasdaq Exchange.
Finally, figure 3 highlights a consistent expansion of total assets since 2014, reflecting the firm’s ongoing commitment to infrastructure development and industrial scale. This expansion has been meticulously managed alongside strategic leverage control; the debt ratio has remained near its historical average of 5.3% and is currently on a downward trend. In summary, Alphabet exhibits significant strength in revenue and income growth, while maintaining minimal and well-controlled leverage risk.
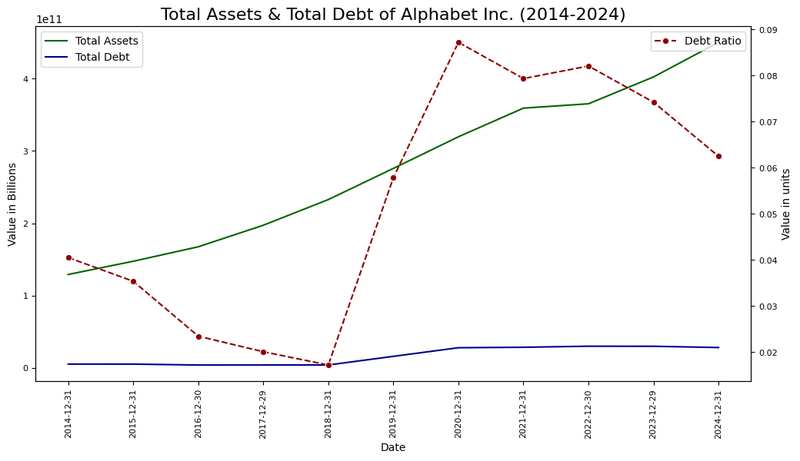
Figure 3. Total assets, total debt, and debt ratio of Alphabet Inc. (2014–2025). Source: Own analysis using data from the Nasdaq Exchange.
Technical analysis of Alphabet’s shares
Regarding the technical outlook, Alphabet’s share price maintains its primary long-term bullish trajectory. Key observations include:
- Trend Context: Over the long term, Alphabet preserves a market structure defined by a sequence of "higher highs" and "higher lows". The price is currently trading significantly above its 50, 100, and 200-day simple moving averages (SMAs), reinforcing the prevailing bullish momentum. However, momentum oscillators—specifically the MACD and RSI—indicate overbought conditions.
- Resistance Levels: Should price action breach the immediate resistance at $344 (the historical peak), the next significant technical level is the upper boundary of the medium-term bullish channel, located near $365. A decisive close above this level would likely initiate a new expansionary phase toward higher valuation zones.
- Support Levels: If the immediate support at $328 is invalidated, the next critical floor is identified at $300. This level aligns with the 100-day SMA and represents a significant psychological zone. A failure to defend the $300 level would substantially increase the probability of a more pronounced market correction.
- Momentum and Volume: The Moving Average Convergence Divergence (MACD) indicates a bearish divergence that has been developing for approximately two months. Concurrently, the Relative Strength Index (RSI) is trading within the overbought zone. Taken together, these indicators suggest the likelihood of a short-term correction or a phase of price consolidation.
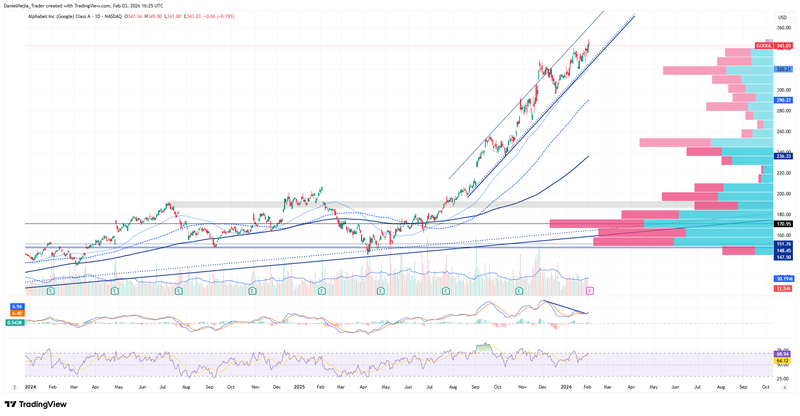
Figure 4. Alphabet’s share price performance and technical indicators (2024–2026). Source: Data from the Nasdaq Exchange; Own analysis conducted via TradingView.


