Bitcoin nears US$100,000 as risk appetite cools
Bitcoin has fallen about 17% from its record high of $125,000 reached in October.

Bitcoin has retraced c. 17% from its October peak of US$125,000, reflecting a reassessment of risk appetite amid monetary-policy uncertainty.
Ongoing US data gaps linked to the government shutdown have reduced clarity on the Federal Reserve’s path, lifting volatility in risk assets including cryptocurrencies.
Bitcoin trades below its long-term moving averages, while it faces key supports around US$100,000 and US$94,000.
Bitcoin prices: current context
Bitcoin has exhibited notable volatility in recent weeks, pulled lower by a broader cooling in risk appetite and renewed doubts about the timing and scale of US interest-rate cuts. The cryptocurrency has retraced approximately 17% from its record high of US$125,000 reached in October and is currently trading close to the US$100,000 psychological mark.
Two primary forces are at work. First, monetary-policy uncertainty in the United States has increased as Federal Open Market Committee members continue to debate the outlook but lack a full complement of official economic indicators while the federal shutdown persists. The absence of timely employment data complicates the Fed’s decision-making and reduces investor confidence in forward guidance. Second, a rotation into perceived safe havens — notably gold, which has continued to set new highs — has drawn some hedging demand away from risk assets, undermining the narrative that Bitcoin functions as a reliable store of value in the same way.
Investors are therefore recalibrating exposures. In conditions where policy is expected to ease clearly, holding riskier assets is relatively more attractive because the opportunity cost falls; conversely, when policy direction is ambiguous and downside risks to growth rise, allocations tend to favour lower-volatility or liquid safe assets. Bitcoin’s failure to sustain its October peaks while gold continued to perform strongly has reinforced questions about its role as an inflation hedge.
Technical analysis of Bitcoin
From a technical standpoint, Bitcoin remains within a longer-term ascending channel that began in October 2023, but short- and medium-term signals point to weakness:
- Trend context. Price is trading below the 50-, 100- and 200-day moving averages, a configuration typically associated with reduced upward momentum and a higher probability of corrective moves. Nonetheless, the channel’s longer-term slope still provides a relevant framework of support levels.
- Resistance levels. Immediate upside pivots are located at roughly US$107,000, US$115,000 and the prior peak at US$125,000. A convincing break and hold above these thresholds would be required to re-establish bullish conviction.
- Support levels. Key downside floors to monitor are US$100,000 (psychological support) and c. US$94,000 (channel floor). A sustained break below US$94,000 would increase the probability of a deeper correction and likely accelerate selling pressure.
- Momentum and trend strength. The MACD histogram has declined, signalling diminishing bullish momentum. The Average Directional Index (ADX) exceeds 25, which indicates the presence of a meaningful trend; the negative directional indicator (−DI) trading above the positive directional indicator (+DI) suggests that the current trend is biased to the downside.
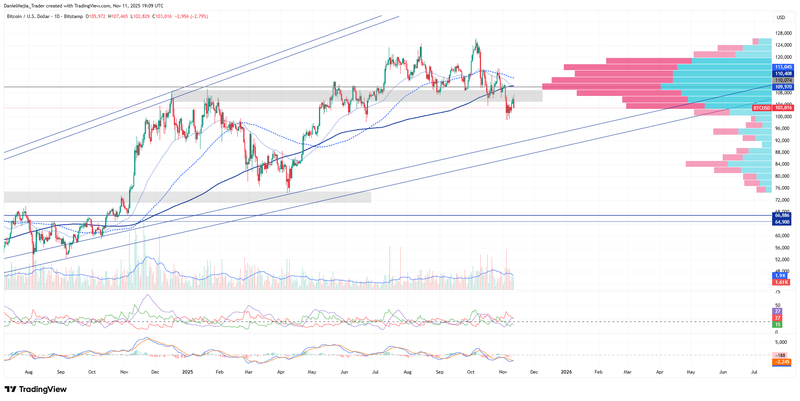
Figure 1. Bitcoin prices (2024–2025). Source: Data from the Nasdaq Exchange. Own analysis conducted via TradingView.


