Dollar Index dips amid slowing momentum in ISM Services PMI
The US Dollar Index (DXY) retreated after the March ISM Services PMI moderated to 54.0, underperforming analyst expectations. Significant contractions in employment and a slowdown in new export orders weighed on the greenback, despite intensified price pressures within the sector. While short-term technical indicators suggest a bullish pivot, the DXY faces a critical test at the 100.00 psychological threshold within a primary medium-term bearish trend.

Although the services sector remains in expansionary territory, the sharp decline in the employment sub-index to 45.2 and the softening of new export orders indicate mounting internal headwinds.
The DXY is currently testing the 100.00 level. As a major pivot point, a failure to decisively breach this resistance could reinforce the currency's medium-term bearish trajectory.
Short-term momentum indicators, including the MACD and RSI, are trending upwards; however, the index remains constrained by a medium-term descending channel, making upcoming fundamental data vital for a directional breakout.
ISM Services PMI softens below analyst expectations
According to data released by the Institute for Supply Management (ISM), the US Services PMI decelerated from 56.1 in February to 54.0 in March, falling short of the consensus forecast of 55.0. Despite the slowdown, the indicator continues to signal expansion, remaining above the neutral 50.0 threshold. The ISM report highlighted that the most significant contractions occurred in employment (falling from 51.8 in February to 45.2 in March), new export orders (declining from 57.2 to 50.7), and business activity (dropping from 59.9 to 53.9).
In contrast, the most prominent increases were reported in prices, which surged from 63.0 to 70.7, alongside rises in imports (51.8 to 55.2) and supplier deliveries (53.9 to 56.2). Following the release, the Dollar Index declined by 0.20% to 99.8 points, testing a significant resistance zone near the 100.00 psychological barrier. Given that this level has historically functioned as a formidable ceiling, the broader fundamental context will be essential in establishing a clearer market direction.
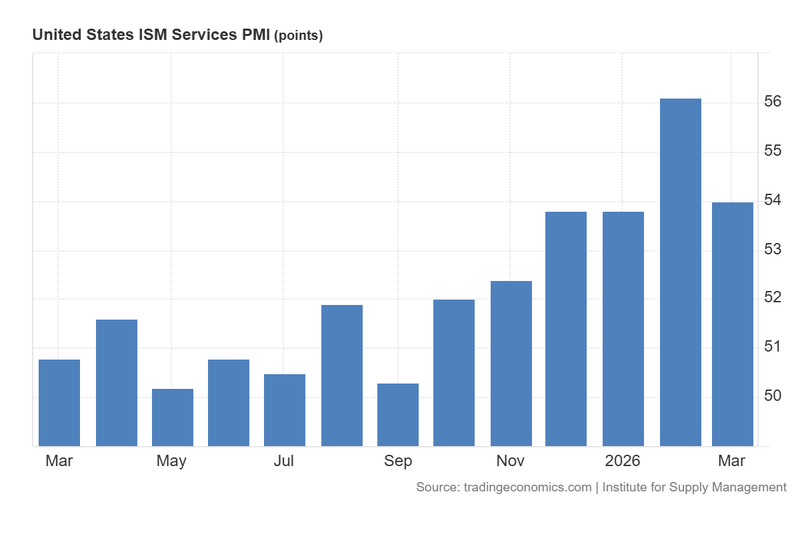
Figure 1. US ISM Services PMI (2025-2026). Source: Data from the Institute for Supply Management; Figure obtained from Trading Economics.
Technical analysis of the Dollar Index (DXY)
From a technical perspective, the Dollar Index remains positioned within a primary medium-term bearish trajectory. However, the current market structure reveals a notable short-term bullish pivot:
- Trend Context: Over the medium term, the index continues to trade within a descending channel pattern. Nevertheless, the recent rally has propelled the DXY above its 50, 100, and 200-day Simple Moving Averages (SMAs). The index is currently testing a key structural resistance zone, which may serve as a catalyst for further bullish momentum if breached.
- Resistance Levels: To the upside, the 101.00 level represents a formidable technical hurdle. A decisive breakout above this threshold would shift market focus toward the 104.0 handle. A sustained move above 104.0 would signal a significant transition into a higher trading range.
- Support Levels: On the downside, immediate support is identified at 98.5, situated in close proximity to the 200-day SMA. Should this floor be breached, the next critical area of interest is 96.5, representing significant short-term structural support. A failure to hold the 96.5 level would likely facilitate a deeper bearish correction.
- Momentum Indicators: Both the Moving Average Convergence Divergence (MACD) and the Relative Strength Index (RSI) are trending upwards, indicating a strengthening of short-term bullish pressure. However, as both indicators approach overbought territory, the role of macroeconomic fundamentals will be pivotal in determining the sustainability of further technical gains.
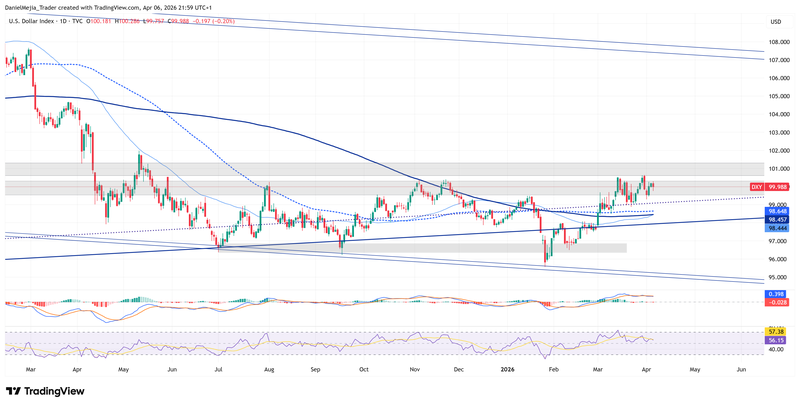
Figure 2. Dollar Index DXY (2024–2026). Source: Data from the Intercontinental Exchange (ICE); own analysis conducted via TradingView.


