Dollar index dips but holds long-term uptrend
The US Dollar Index eased during today’s session after a series of relatively hawkish remarks from Federal Reserve officials lowered market confidence in an imminent December rate cut.

Fed officials’ recently more hawkish tone has reduced the market’s confidence in a December easing, weighing on risk assets and prompting a modest USD retracement.
The end of the government shutdown restores regular data flows; upcoming employment and inflation releases will be decisive for policy expectations and dollar momentum.
Technically, the Dollar Index retains a longer-term bullish structure (channel), but it is trading below the 200-day moving average, producing a mixed technical picture.
Dollar index: current context
Several members of the Federal Open Market Committee have shifted toward a more cautious or hawkish rhetoric in recent communications, prompting market participants to reassess the probability of an interest-rate cut in December. Commentators attribute part of that change in tone to uncertainty surrounding the true state of the US economy while official data were delayed during the government shutdown.
With the shutdown now ended, government agencies will resume regular reporting. Market attention will focus on employment metrics and inflation prints that had been postponed; those releases will be central to the Fed’s deliberations and are likely to be closely watched by FX traders. In the near term, uncertainty about the scale and timing of any policy easing has produced episodic volatility for the dollar as investors balance hawkish rhetoric against signs of slowing activity in some segments of the economy.
Technical analysis on Dollar index
From a technical perspective, the Dollar Index presents a mixed but constructive picture:
Trend context. Over the long term the index remains inside an upward channel established over the past periods, signifying an enduring bullish bias. At the same time, the DXY is trading just below its 200-day moving average, which tempers the bullish case and signals that the most recent advance has paused. In the medium term the index appears range bound, while short-term price action shows a sequence of higher highs and higher lows.
Resistance levels. Immediate upside obstacles are located near 100 (a structural pivot and close to the 200-day moving average) and 101 (a medium-term resistance area). A convincing break above these levels — particularly on rising volume and with confirmation across other USD pairs — would support a possibly further dollar appreciation.
Support levels. On the downside, the first meaningful support resides near 98.90 (near the 50- and 100-period moving averages). The next structurally important floor is the bullish channel base at 97.90. A sustained break beneath 97.90 would increase the likelihood of a deeper corrective phase.
Momentum indicators. Short-term momentum metrics (MACD, RSI) currently show modest bullish divergence, consistent with the short-term higher-low structure; however, the proximity to the 200-day average and the midrange consolidation suggest that directional conviction remains limited until macro releases provide clearer guidance.
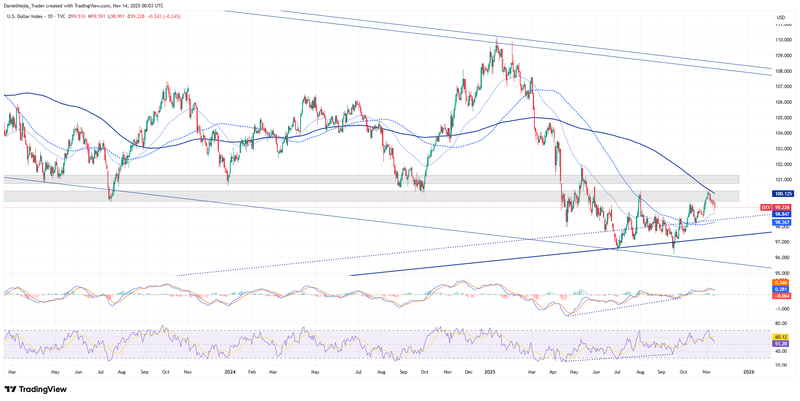
Figure 1. Dollar Index (2023–2025). Source: Intercontinental Exchange (ICE); analysis via TradingView.


