Dow Jones falls as inflation risks rise amid geopolitical tensions
Escalating hostilities in the Middle East have severely disrupted global energy supplies, driving crude oil prices up by 50% over the past month. This inflationary spike is compelling the Federal Reserve to re-evaluate its monetary policy trajectory. Consequently, the Dow Jones Industrial Average has entered a significant correction, retreating toward key support levels amidst heightened economic and monetary uncertainty.

Global energy prices have soared, with Brent and WTI crude futures appreciating by approximately 50% in a single month, stoking fears of entrenched global inflation.
Rising input costs have dampened expectations for 2026 rate cuts; the CME FedWatch Tool now indicates a market shift toward a more restrictive Federal Reserve stance.
The Dow Jones has declined 9.5% from its cyclical peak, testing critical support levels as momentum indicators signal a strengthening downward impulse.
Geopolitical tensions in the Middle East pressure the Fed amid rising inflation risks
US equity markets have experienced a synchronous decline as geopolitical instability in the Middle East intensifies, evolving from localised friction into a broader regional conflict. The situation deteriorated significantly following coordinated strikes by the United States and Israel against Iranian territory and its critical energy infrastructure. In retaliation, Iran have impacted energy facilities in Qatar, Kuwait, the United Arab Emirates, Saudi Arabia, and Bahrain—nations that are not direct participants in the conflict. The resulting disruption to regional infrastructure has injected substantial uncertainty into global energy supply chains.
The volatility in the energy sector is exerting significant pressure on global markets, particularly as central banks grapple with the inflationary consequences of surging fuel costs. Over the past month, Brent and WTI crude futures have appreciated by an average of 50%, while gasoline futures have climbed by 45%. This trend is further compounded by a significant spike across various global liquefied natural gas (LNG) benchmarks. Consequently, there is growing apprehension that monetary authorities may be forced to adopt a more restrictive policy stance to counteract persistent inflationary pressures, thereby diminishing hopes for a more accommodative economic environment.
Equities are currently facing a dual challenge: the prospect of diminished global economic growth and the likelihood of "higher-for-longer" interest rates. Data from the CME FedWatch Tool suggests a pivot in market sentiment regarding the Federal Reserve's trajectory for 2026. While the consensus previously anticipated two interest rate cuts this year, expectations for such easing have largely evaporated. This shift is primarily driven by the dramatic rise in energy prices, which has reignited fears that inflation could become entrenched should the conflict in the Middle East persist or escalate further.
As a result of these headwinds, the Dow Jones Industrial Average depreciated by 0.96% to close at 45,577 points. Since reaching its recent peak, the index has shed approximately 9.5% of its value over the last month.
Technical analysis of the Dow Jones index
From a technical perspective, the Dow Jones continues to adhere to a long-term bullish framework; however, the immediate price action warrants a period of retracement. Key observations include:
- Trend Context: Over the long term, the index maintains a classic market structure characterised by "higher highs" and "higher lows". However, the current price is trading below its 50, 100, and 200-period Simple Moving Averages (SMAs). Short-term momentum indicators are currently signalling a strengthening downward impulse.
- Resistance Levels: Should the index achieve a decisive breach of the short-term resistance at 50,130 (the recent historical high), market focus will likely shift toward the significant psychological threshold of 50,500. A sustained move above this level would signal an extension of the bull market into uncharted territory.
- Support Levels: On the downside, immediate support is identified at the 45,000 structural level. A failure to maintain this floor would bring the support level of 43,300—representing the upper boundary of the long-term upward trend line—into focus. A breach of the 43,300 zone would significantly increase the probability of a more profound structural correction.
- Momentum Indicators: Both the Moving Average Convergence Divergence (MACD) and the Relative Strength Index (RSI) are exhibiting a structure of lower highs, following a bearish divergence in the MACD indicator. Nevertheless, both indicators are currently nearing oversold territory, which may precede a temporary relief rally.
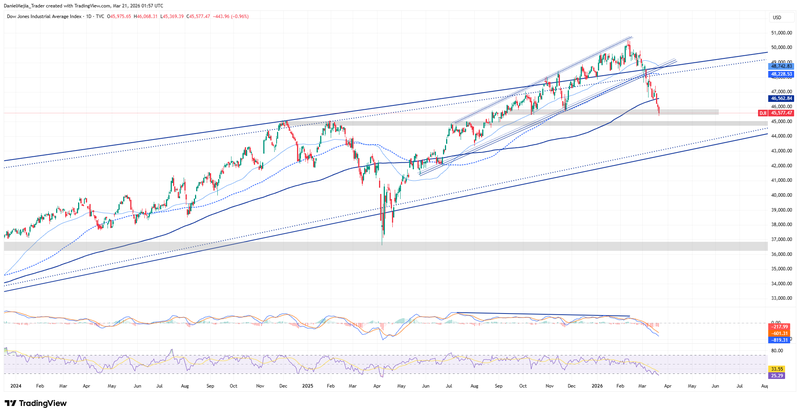
Figure 1. Dow Jones Index (2024-2026). Source: Data from the NYSE Exchange; Own analysis conducted via TradingView.


