Dow Jones pressured by technicals and economic uncertainty
The Dow Jones Industrial Average encountered downward pressure as markets absorbed growing uncertainty about the US economic data flow and as a number of technical resistance patterns proved constraining. The Bureau of Labor Statistics’ decision to cancel October’s CPI release — and to postpone November’s CPI until after the Federal Reserve meeting — has heightened policy uncertainty.

The Bureau of Labor Statistics cancelled the October CPI release and delayed November’s print until 18 December, creating a notable gap in official inflation data ahead of the Fed’s scheduled meeting on 10 December.
Reduced visibility on inflation increases policy uncertainty and complicates the Fed’s decision-making, which in turn has pressured equity markets, including the Dow.
Elevated valuation concerns in large-cap technology names are encouraging profit-taking and have amplified downside sensitivity across the index.
Technical indicators show the Dow remains in a long-term uptrend, but short-term supports are being tested.
The cancelled October CPI adds uncertainty
The US Bureau of Labor Statistics (BLS) announced that it will not publish the October Consumer Price Index owing to the absence of key source data collected during the recent government shutdown. In addition, November’s CPI — originally scheduled for 10 December — has been postponed to 18 December, which means the Federal Open Market Committee will not have the contemporaneous official inflation measure before its 10 December meeting.
Concurrently, persistent debate about stretched valuations — particularly for large technology firms that account for a growing share of market capitalisation — has encouraged some market participants to reduce exposure to risk assets. The combination of policy uncertainty and valuation reassessment is therefore exerting a meaningful drag on the Dow’s near-term performance, even as its long-term trend remains intact.
Technical analysis on Dow Jones index
From a technical perspective, the Dow Jones index maintains its long-term bullish trend; however, critical support levels are currently being tested in the short term. Key observations include:
- Trend context. In the long term, the Dow Jones index retains a market structure characterised by higher highs and higher lows. However, in the short term, key support levels are being tested (specifically, short-term support and the 100-day moving average). Conversely, a long-term ceiling is currently being respected, limiting upside movement.
- Resistance levels. Should the short-term resistance at 46,875 be breached to the upside, the next significant ceiling corresponds to the historical high of 48,250. A decisive break above these levels would suggest the potential for an extension into higher price zones.
- Support levels. If the support at 45,500 (coinciding with the 100-day moving average) is broken to the downside, the next relevant floor is located at 44,000 (the 200-day moving average and a significant psychological level). A loss of the 44,000 zone would increase the probability of a deeper market correction.
- Momentum indicators. The MACD displays a bearish divergence, signalling a weakening of the prevailing bullish trend. Furthermore, the ATR (Average True Range) index is exhibiting a turning point, which may indicate rising volatility and an increased likelihood of a correction.
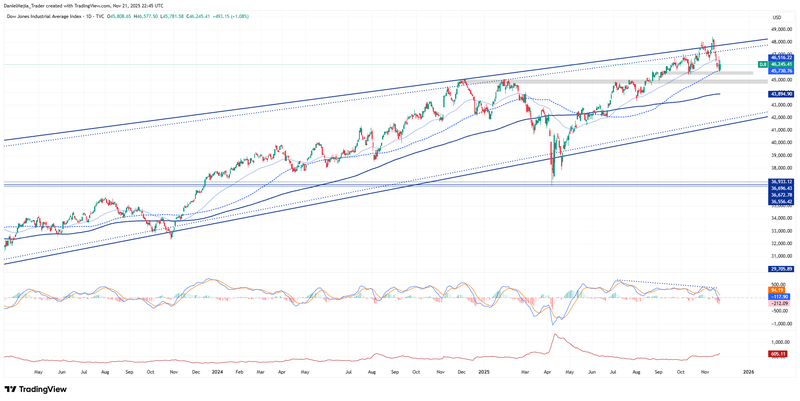
Figure 1. Dow Jones index (2024-2025). Source: Data Own analysis conducted via TradingView.


