Gold slides on geopolitical easing and hawkish policy signals
The gold futures contract (GCJ26) experienced a significant decline amid growing optimism regarding a potential de-escalation in the US–Israel–Iran conflict. This downward pressure was further compounded by rising market expectations that Western central banks may adopt more restrictive monetary stances in response to persistent inflationary risks.

Gold futures on the COMEX exchange depreciated by 3.6% during the trading session, marking a cumulative 17% decline from their recent record highs.
Bullion valuations are softening due to a confluence of factors, notably the prospect of "higher-for-longer" interest rate policies in the West and a reduction in the geopolitical risk premium in the Middle East.
Long-term structures in gold continue to respect the 200-day Simple Moving Average (SMA), while short-term momentum indicators—specifically the MACD and RSI—have entered oversold territory.
Gold prices retrench amid hopes of geopolitical de-escalation and hawkish central bank signals
At the market close, the gold futures contract (GCJ26) depreciated by 3.6% to settle at $4,407 per ounce. The precious metal has now retreated 17% from its historical peak over recent weeks. This corrective phase can be attributed to a dual catalyst: a potential shift by Western central banks contemplating more restrictive policies to counter energy-driven inflation, and a perceived de-escalation in tensions between the US, Israel, and Iran—over the last days.
On the one hand, several major institutions, including the European Central Bank (ECB), the Bank of Japan (BoJ), and the Bank of England (BoE), have indicated a readiness to employ hawkish tools should rising energy costs push inflation beyond their respective mandates. Concurrently, Federal Reserve officials have reaffirmed that price stability remains their primary objective, pivoting away from previous signals that suggested imminent rate cuts to support the employment sector. Historically, bullion prices face headwinds when US monetary policy is restrictive; as the US dollar appreciates due to increased demand for Treasury yields, dollar-denominated gold becomes more expensive for international buyers, dampening demand.
On the other hand, geopolitical anxiety eased following statements from the US president Donald Trump regarding productive dialogues with Tehran. Consequently, the President ordered a postponement of military strikes against Iranian energy infrastructure—targets that had been under threat of engagement over the weekend. While Iranian officials have denied these discussions, the mere prospect of lower geopolitical friction has decreased the implied risk premium. As a traditional safe-haven asset, gold tends to lose momentum when global systemic risks are perceived to be receding.
Technical analysis of Gold
From a technical perspective, gold futures maintain a robust long-term bullish trajectory. A detailed analysis of the current market structure reveals several key observations:
- Trend Context: Over the long term, gold continues to exhibit a market structure defined by a series of "higher highs" and "higher lows". The price is currently testing its 200-day Simple Moving Average (SMA), a critical level that has thus far confirmed the underlying strength of the prevailing trend despite the 17% retracement from all-time highs.
- Resistance Levels: Should the immediate short-term resistance at $4,850 be breached, the next significant technical ceiling is identified at the record high of $5,350. A sustained move above this threshold would signal a potential extension into uncharted price territory.
- Support Levels: In the event of further contraction, immediate short-term support is identified at $4,100, where the 200-day SMA converges with a long-term ascending trend line. If this level is invalidated, the next structural floor is located at $3,900. A breach of $3,900 would notably increase the probability of a deeper market correction.
- Momentum and Volume: Both the Moving Average Convergence Divergence (MACD) and the Relative Strength Index (RSI) are currently trading in oversold territory. This suggests that the downward momentum may be reaching a point of exhaustion, potentially leading to a technical pause or a relief rally.
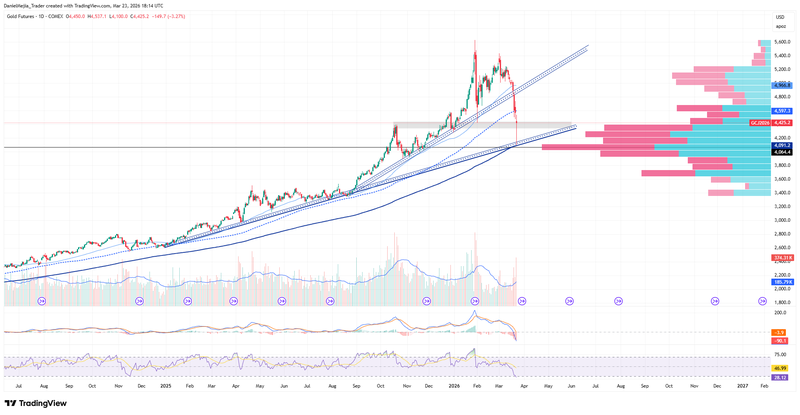
Figure 1. Gold Future Contract GCJ26 (2024–2026). Source: Data from the COMEX Exchange; own analysis conducted via TradingView.


