Intel surges ~12% ahead of Q4-2025 earnings: financial and technical analysis
Intel’s share price rose by 11.72% ahead of its Q4 2025 results, with analysts anticipating a robust performance driven by increasing demand for server CPUs.

Shares surged amid expectations of strong demand and positive corporate guidance for the 2026 fiscal year.
The technology firm has demonstrated a significant recovery in earnings over previous quarters, coupled with stable asset growth.
The technical perspective signals continued strength in bullish momentum, although indicators are approaching overbought territory.
Intel’s shares rise considerably before Q4 results
Intel’s shares climbed 11.72% prior to the delivery of its Q4 2025 financial results, closing at $54.25 per share. The quarterly results are scheduled for release on Thursday, 22 January (after the market close). Analysts anticipate better-than-expected results, attributed to robust demand for server CPUs and a positive outlook from the company for 2026. Regarding market forecasts, the consensus expects revenue of $13.44 billion (representing a year-on-year decrease of 2.8%) and earnings per share (EPS) of $0.08 (implying a year-on-year contraction of 33%).
Financial analysis of Intel Corporation
From a financial perspective, Intel Corporation has previously faced challenges regarding revenue and profit growth; however, the figures from the most recent quarters have demonstrated a significant recovery.
Figure 1 illustrates that Intel’s revenue and net income have exhibited a downward trend over the last five years; nonetheless, there has been a notable recovery in net income since June 2025. Additionally, total revenue growth has remained largely stagnant, averaging –2.8% during the period under review. Conversely, the net income growth rate has displayed elevated volatility, with the most significant increase occurring in Q3 2025.
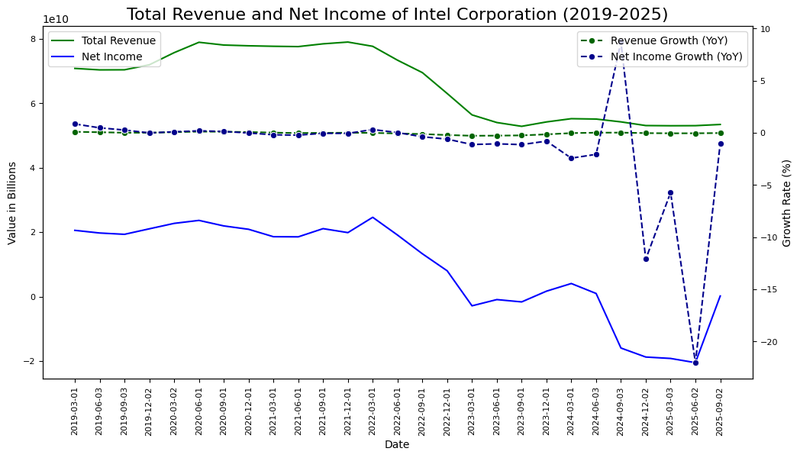
Figure 1. Total revenue, net income, revenue growth rate, and net income growth rate of Intel Corporation (2019-2025). Source: Own analysis using data from the Nasdaq Exchange.
Furthermore, Figure 2 demonstrates that while the net margin has followed a general downtrend, Q3 2025 exhibited a prominent recovery. Market participants may interpret this as a positive turning point in the company's profitability pattern.
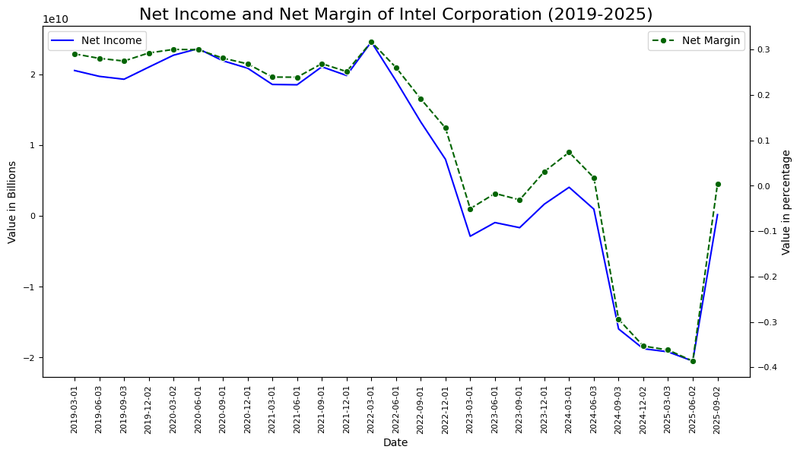
Figure 2. Net margin trends and profitability analysis of Intel Corporation (2019-2025). Source: Own analysis using data from the Nasdaq Exchange.
Finally, Figure 3 indicates that Intel’s assets have maintained stable growth. This has been accompanied by a rising debt ratio, which has trended upwards. Despite this increase, the current debt ratio remains manageable at 25.68%.
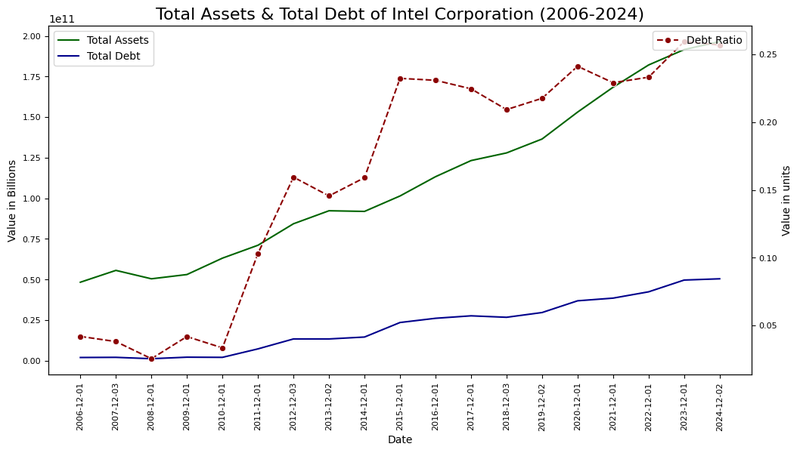
Figure 3. Total assets, total debt, and debt ratio of Intel Corporation (2006-2025). Source: Own analysis using data from the Nasdaq Exchange.
Technical analysis of Intel’s Share Price
Regarding the technical outlook, Intel’s share price maintains its primary bullish trend. Key observations include:
- Trend Context: In the long term, Intel Corporation retains a market structure characterised by "higher highs" and "higher lows". The share price is currently trading considerably above its 50, 100, and 200-period moving averages, while a long-term resistance is being breached to the upside.
- Resistance Levels: Should the short-term resistance at $55 be broken, the next significant ceiling is the $69 level—a critical long-term resistance zone. A decisive breakout above this level would open the possibility of higher price targets.
- Support Levels: If the support at $51 is breached, the next relevant floor is situated at $38. This level sits near the volume profile’s Point of Control (POC) and aligns approximately with the 100-period moving average. A failure to hold the $38 zone would increase the probability of a more pronounced market correction.
- Momentum Indicators and Volume: The MACD (Moving Average Convergence Divergence) and the RSI (Relative Strength Index) exhibit strengthening bullish impulse, though they are nearing overbought levels. Nevertheless, the primary trend remains firmly bullish.
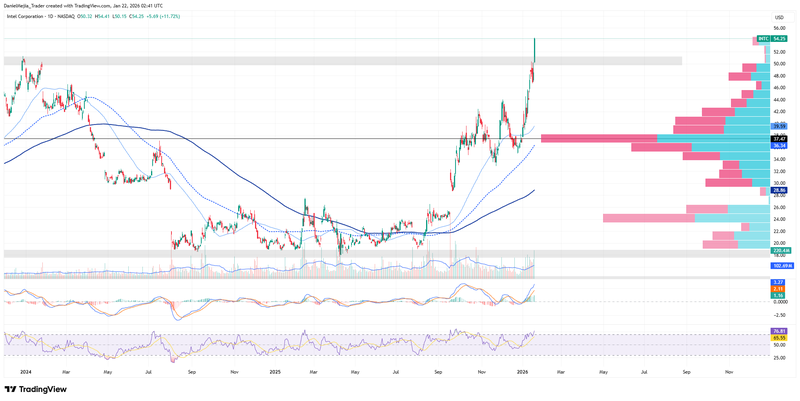
Figure 4. Intel’s share price performance and technical indicators (2024-2026). Source: Data from the Nasdaq Exchange; Own analysis conducted via TradingView.


