IonQ earnings preview: Financial and technical analysis
IonQ, a pioneer in the trapped-ion quantum computing sector, is approaching the release of its fourth-quarter 2025 financial results. The company has maintained a significant growth trajectory in total revenue while aggressively pursuing a strategy of vertical integration through strategic acquisitions to consolidate its leadership within the quantum industry.

Market analysts anticipate a year-on-year (YoY) revenue increase of approximately 245%, though net income is expected to remain in negative territory as the firm continues its heavy investment phase.
Throughout the recent quarter, IonQ has executed a series of high-impact acquisitions, including Oxford Ionics and Vector Atomic, to enhance its core quantum platform.
The company has formalised a collaboration with Oak Ridge National Laboratory to develop advanced quantum-classical workflows and energy-sector applications.
IonQ’s share price maintains a long-term bullish structure; however, short-term price action is currently exhibiting a period of consolidation following recent volatility.
IonQ: earnings expectations
IonQ Inc. is scheduled to release its Q4 2025 financial results on 25 February 2026. The analyst consensus projects total revenue of approximately $40.39 million, representing a significant year-on-year growth rate of 245%. Conversely, earnings per share (EPS) are forecast at –$0.51, representing a YoY contraction of roughly 104%. Despite these impacts on net profitability, the firm remains committed to its long-term growth roadmap, prioritising technological leadership, strategic alliances, and the expansion of its intellectual property portfolio.
Financial analysis of IonQ Inc.
From a fundamental perspective, Figure 1 illustrates that while total revenue has achieved a prominent average growth rate of 207% over the last three years, net income has been adversely affected by the costs associated with rapid scaling, averaging annual losses of approximately 93% over the same period.
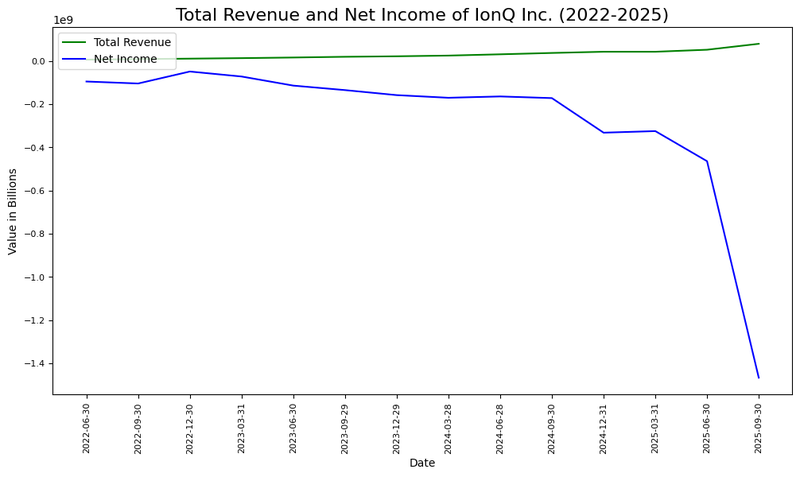
Figure 1. Total revenue, net income, and respective growth rates of IonQ Inc. (2020–2025). Source: Own analysis using data from the NYSE Exchange.
As shown in Figure 2, IonQ’s net margin has followed a downward trend in recent years, with a historical average of –8.3%. However, it is important to note that a substantial portion of these negative results has been attributed to "unusual expenses"—specifically non-cash charges—which do not represent immediate cash outflows or operational inefficiency.
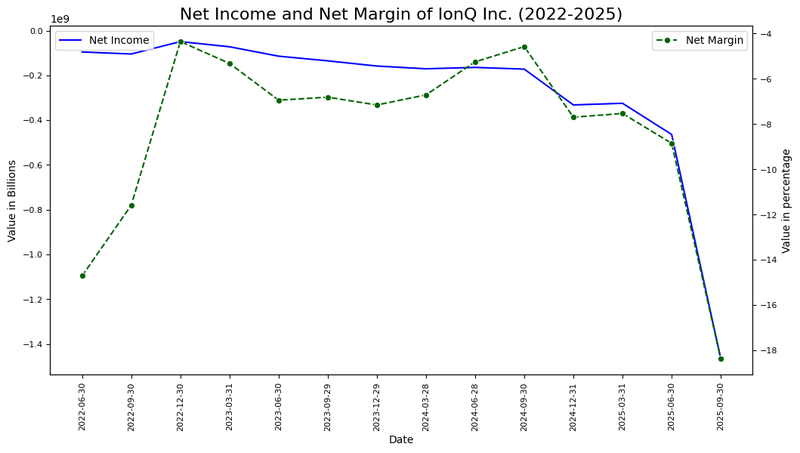
Figure 2. Net margin trend and profitability analysis of IonQ Inc. (2020–2025). Source: Own analysis using data from the NYSE Exchange.
Figure 3 highlights a year-on-year decrease in total assets, yet the firm has successfully kept its debt levels well-contained; the debt ratio has consistently remained below the 5% threshold. Strategic capital allocation remains a priority, evidenced by the Q3 2025 acquisitions of Oxford Ionics and Vector Atomic. These moves, alongside the partnership with Oak Ridge National Laboratory, are designed to accelerate the development of key "IonQ" platforms and enhance quantum-classical workflows for complex industrial applications.
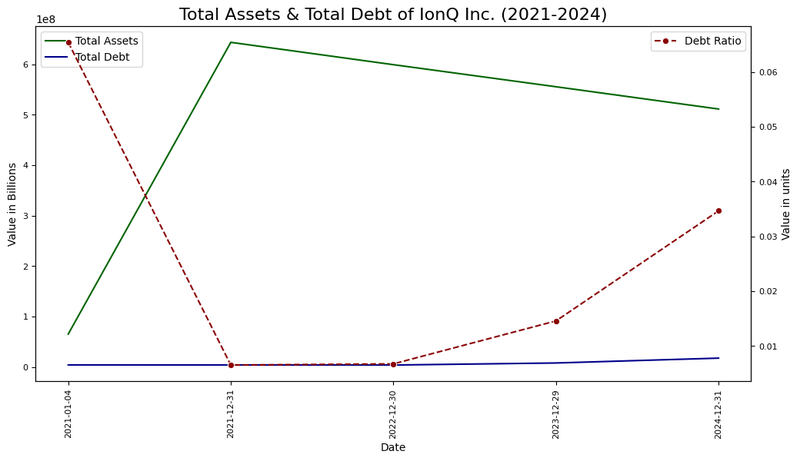
Figure 3. Total assets, total debt, and debt ratio of IonQ Inc. (2020–2024). Source: Own analysis using data from the NYSE Exchange.
In summary, while IonQ demonstrates robust top-line strength, its net performance remains constrained by non-recurring items and an intensive commitment to inorganic growth and collaborative research.
Technical analysis of IonQ’s shares
Technically, IonQ’s share price retains its primary long-term bullish trajectory, although a consolidation phase has emerged in the short term. Key observations include:
- Trend Context: Over the long term, the stock preserves a bullish market structure characterised by a sequence of "higher highs" and "higher lows". However, the price is currently trading beneath its 50, 100, and 200-day simple moving averages (SMAs), confirming a loss of immediate momentum and the onset of a possible consolidation range.
- Resistance Levels: Should the price action breach immediate resistance at $35, the next major technical hurdle is identified at $53 (medium-term resistance). A decisive close above this level would likely trigger a new expansionary phase toward higher valuation zones.
- Support Levels: Immediate support is located at $30. Should this floor be invalidated, the next critical structural support is found at $20. A failure to defend the $20 zone would significantly heighten the probability of a broader market correction.
- Momentum and Volume: Both the Moving Average Convergence Divergence (MACD) and the Relative Strength Index (RSI) are currently trending downwards. Notably, the RSI is approaching oversold territory, which may signal a possible stabilisation point for demand.
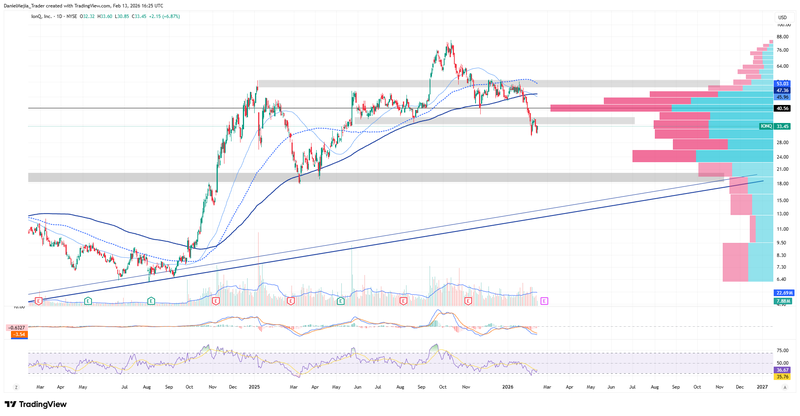
Figure 4. IonQ’s share price performance and technical indicators (2024–2026). Source: Data from the NYSE; Own analysis conducted via TradingView.


