Japanese yen falls amid weakness in Q3 GDP data
Japan’s GDP growth rate contracted in the third quarter, highlighting economic weakness in the Asian nation and impacting the Japanese Yen at the daily close.

The Japanese GDP growth rate fell by 0.6%, a contraction worse than the analysts' consensus forecast.
A significant decrease in exports to the United States weighed heavily on the Japanese economy, given the US market’s substantial share of total exports.
The Japanese Yen depreciated by approximately 0.39% against the US Dollar, approaching a long-term structural resistance level.
Japanese GDP growth rate shows contraction in Q3
According to data from the Cabinet Office of Japan, the GDP growth rate for the third quarter dropped by 0.6%, reversing from +0.5% in Q2 and marking a contraction sharper than the analyst forecast of -0.4%. This updated data represents the first quarterly contraction since Q1 2024 and underscores the fragility of the Japanese economy, which continues to oscillate between periods of expansion and contraction.
One of the most notable factors explaining this contraction is the negative impact of net trade; in July, August, and September, the balance of trade decreased by an average of ¥198 billion—according to data from the Ministry of Finance. Tariffs imposed by the United States have adversely affected Japanese commerce, even though the tariff rate was reduced to 15%. The US market accounts for approximately 20% of total Japanese exports, making this decline particularly impactful.
The Japanese economy has exhibited weakness across key indicators, including GDP and the inflation rate (currently at 3%). However, the Japanese government has announced a significant stimulus package to support the economy.
Regarding the market reaction, the Japanese Yen depreciated by 0.39% against the US Dollar, trading at approximately ¥155.90.
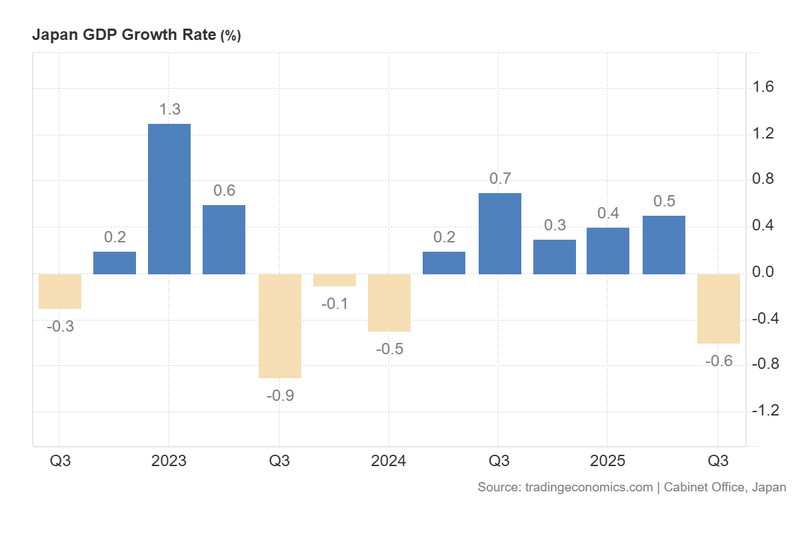
Figure 1. Japan GDP Growth Rate (quarter-on-quarter). Source: Data from Cabinet Office, Japan; chart obtained from Trading Economics.
Technical analysis of the USD/JPY pair
From a technical perspective, the USD/JPY pair is forming a consolidation pattern; nevertheless, the price remains above its long-term moving averages, maintaining its bullish momentum. Key observations include:
- Trend context. In the long term, USD/JPY is forming a broad consolidation pattern, signaling uncertainty. In the short term, the trend remains bullish—characterised by a structure of higher highs and higher lows—while the price continues to respect its moving averages (50, 100, and 200 periods). However, it is relevant to note that the structural resistance near ¥158 represents a critical zone where the volume profile indicates significant distribution.
- Resistance levels. Should the short-term resistance at ¥157.80 be breached to the upside, the next significant ceiling corresponds to the level of ¥160 (structural resistance and a key psychological level). A decisive break above these levels would suggest the potential for an extension into higher price zones.
- Support levels. If the short-term support at ¥154.50 is broken to the downside, the next relevant floor is located at ¥151 (a structural pivot point coinciding with the 200-day moving average). A loss of the ¥151 zone would increase the probability of a deeper market correction.
- Momentum indicators. Both the MACD and RSI indicators are currently residing in overbought territory; however, there are no bearish divergences, indicating that the bullish momentum remains in force.
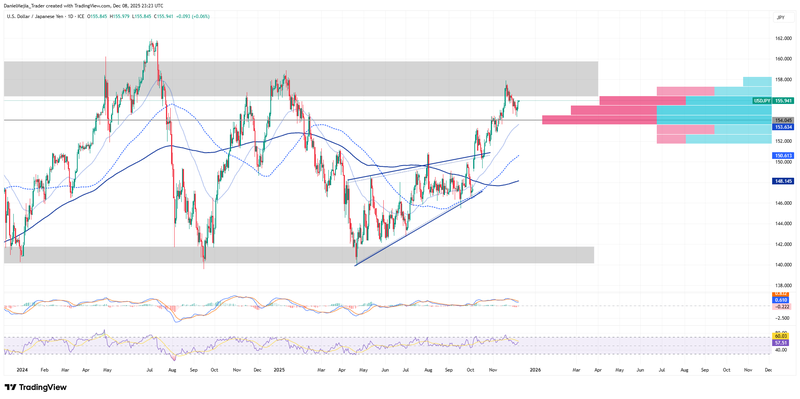
Figure 2. USD/JPY pair (2024-2025). Source: Own analysis conducted via TradingView.


