Microsoft shares rise ahead of earnings: Financial and technical analysis
Microsoft’s share price appreciated by 2.19% one day ahead of its quarterly financial release. Financial analysis reveals a robust performance across both income and investment, underpinned by low leverage risk. Conversely, technical indicators signal emerging downward pressure, contrasting with a strong long-term bullish performance.

Microsoft shares closed up 2.19% at $480.58, immediately preceding the release of its Q2 FY2026 financial results.
Market expectations suggest a year-on-year (YoY) revenue growth rate of 15.2%, while earnings per share (EPS) are projected to rise by 21.7% YoY.
Despite a sustained long-term bullish trend, the price is currently trading below the 50, 100, and 200-period simple moving averages (SMAs), indicating a rise in short-term bearish momentum.
Microsoft’s shares rise before quarterly financial release
Microsoft shares rose by 2.19% to reach $480.58, one day prior to the publication of its Q2 FY2026 financial results. According to market consensus, analysts are anticipating total revenue of approximately $80.23 billion, which would represent a 15.2% year-on-year (YoY) increase. Furthermore, the consensus for earnings per share (EPS) stands at $3.93, reflecting a projected growth of 21.7%. Investors remain acutely focused on these results, as the tech giant continues to serve as a primary bellwether for the broader technology sector.
Financial analysis of Microsoft Corp.
From a financial perspective, Microsoft has maintained a stable upward trajectory in revenue and net income. As illustrated in Figure 1, the company has achieved consistent average growth rates of 14% and 31%, respectively, since 2019. Although the net income growth rate experienced a notable deceleration in 2020, total revenue and earnings have successfully stabilised over recent years.
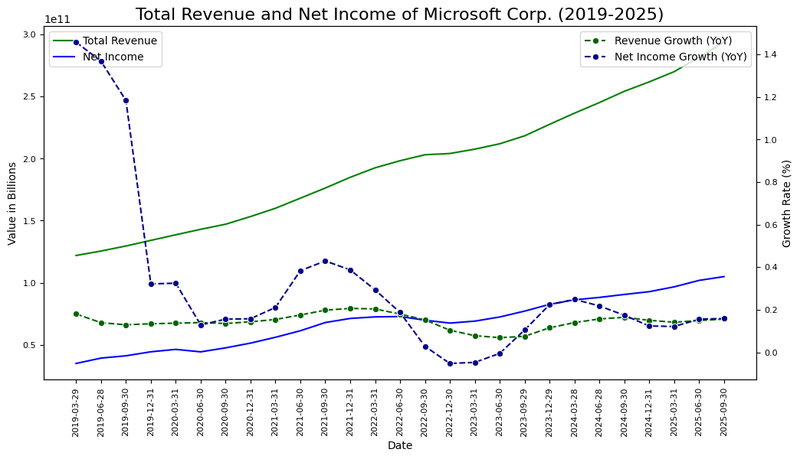
Figure 1. Total revenue, net income, revenue growth rate, and net income growth rate of Microsoft Corp. (2019–2025). Source: Own analysis using data from the Nasdaq Exchange.
Furthermore, Figure 2 demonstrates that the net margin has improved steadily over the observed period, increasing from approximately 28% in Q1 2019 to 36% in Q3 2025. This expansion in net margin has mirrored the sustained upward trend in the company's net income performance.
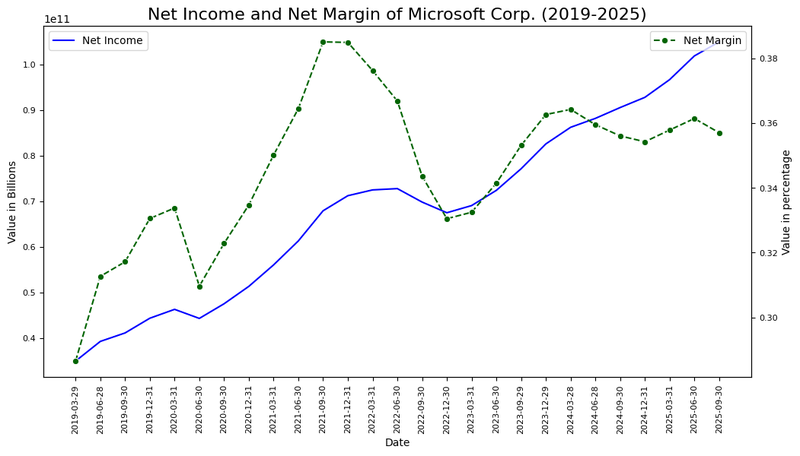
Figure 2. Net margin trend and profitability analysis of Microsoft Corp. (2019–2025). Source: Own analysis using data from the Nasdaq Exchange.
Lastly, Figure 3 reveals a consistent increase in total assets alongside a significant improvement in the debt ratio over the 2012–2024 period. Regarding leverage risk, although the debt ratio peaked at 38.5% in 2017, the indicator has since stabilised to approximately 18.12%. In summary, Microsoft’s financial position is defined by stable growth in revenue and earnings, consistent capital investment, and well-controlled leverage.
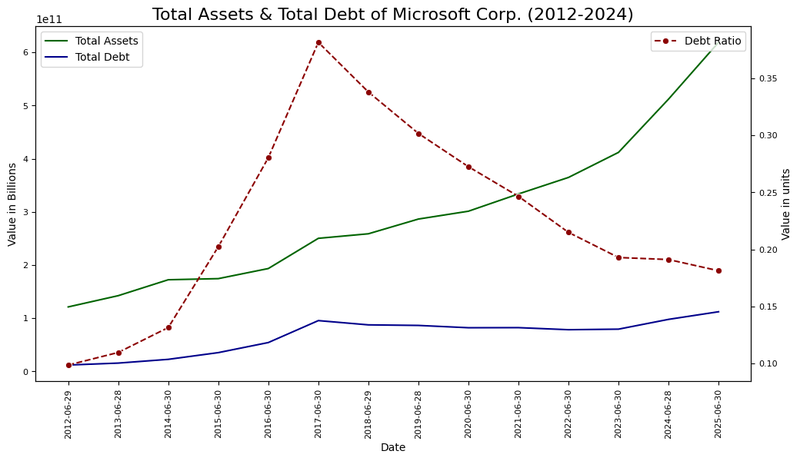
Figure 3. Total assets, total debt, and debt ratio of Microsoft Corp. (2012–2025). Source: Own analysis using data from the Nasdaq Exchange.
Technical analysis of Microsoft’s share price
Regarding the technical outlook, while Microsoft’s share price retains its primary long-term bullish trend, several technical signals point toward a possible period of consolidation. Key observations include:
- Trend Context: In the long term, Microsoft Corp. maintains a market structure characterised by "higher highs" and "higher lows". However, the share price is currently trading below its 50, 100, and 200-period simple moving averages (SMAs). Notably, the 50-period SMA is trending toward a downward crossover with the 200-period SMA, suggesting that bearish pressure is intensifying relative to the prevailing bullish trend.
- Resistance Levels: Should the short-term resistance at $490 be breached (a level coinciding with the 200-period SMA), the next significant technical ceiling is located at the historical peak of $545. A decisive breakout above this level would likely open the door for higher price targets.
- Support Levels: If the immediate support at $460 is invalidated, the next critical floor is situated at $415. This level aligns with the base of a long-term upward trend line. A failure to hold the $415 zone would heighten the probability of a more pronounced market correction.
- Momentum Indicators and Volume: Both the Moving Average Convergence Divergence (MACD) and the Relative Strength Index (RSI) exhibit a neutral performance, indicating that the stock may be entering a short-term period of range-bound consolidation.
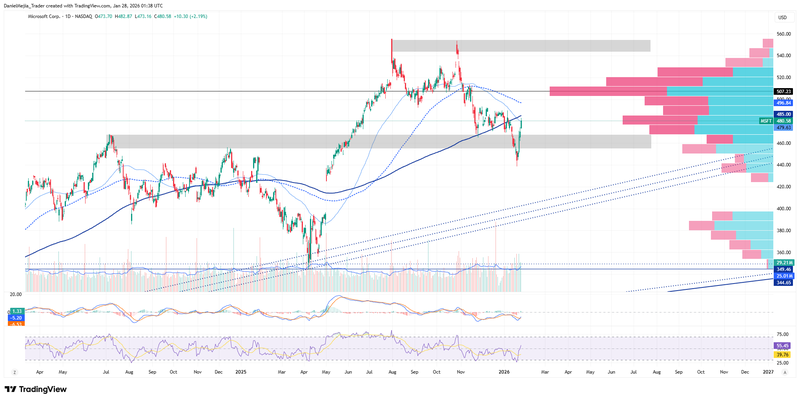
Figure 4. Microsoft’s share price performance and technical indicators (2024–2026). Source: Data from the Nasdaq Exchange; Own analysis conducted via TradingView.


