Russell 2000 gains and 2026 Technical outlook
The Russell 2000 index experienced a notable performance in 2025, posting a total return of approximately 12.8% for the year. While this lagged behind the Nasdaq 100, which gained 21.2%, and the S&P 500, up 17.9%, the small-cap index showed a strong finish in the final months of the year.

The Federal Reserve delivered three consecutive 0.25% rate cuts in late 2025.
Despite the leadership of large caps, Russell 2000 has shown relative strength in short-term trading.
Immediate technical support lies near 2,450, a level that coincides with previous resistance.
Russell 2000 strength and outlook
The Russell 2000’s strong performance in late 2025 was primarily driven by monetary policy easing and valuation re-rating, and current conditions suggest small-cap stocks may continue to benefit into early 2026. The Federal Reserve’s three consecutive 0.25% rate cuts, which lowered the federal funds rate to 3.50–3.75%, reduced borrowing costs for smaller companies that rely heavily on floating-rate debt. This shift eased financial pressure, improved cash flow, and supported investment, refinancing, and shareholder returns. If the Fed maintains a dovish stance in early 2026, liquidity conditions could remain favorable for small caps.
Valuation dynamics remain supportive, even after the recent rally. As of 08 January 2026, Russell 2000 trades at a price-to-earnings ratio of 18.11, still below the S&P 500’s valuation near 22x. This relative discount continues to attract investors seeking higher beta exposure as capital rotates out of richly valued mega-cap stocks. With consensus forecasts projecting 5–7% earnings growth for small caps in Q1 2026, sustained profit improvement could justify further multiple expansion and support additional upside in the index.
Nasdaq and S&P 500 impact on Russell 2000
Nasdaq 100 and S&P 500 led the broader market throughout 2025, driven largely by strong performance among mega-cap technology and growth stocks. The Nasdaq 100 gained 21.24% while the S&P 500 returned 17.88% for the year. Early 2026 trading continued this trend, with both indices reaching and approaching all-time highs in the first week of January. Despite the leadership of large caps, Russell 2000 has shown relative strength in short-term trading, highlighting a rotation of investor interest in smaller-cap stocks. This dynamic is significant because improved small-cap performance often signals stronger market breadth, reflecting a healthier participation across the market rather than reliance on a handful of large-cap leaders.
The Federal Reserve’s dovish pivot in late 2025 played a critical role in this rotation. By lowering interest rates, the Fed reduced capital costs for small-cap companies and encouraged investment in higher-risk, higher-reward sectors. The uncertainty around Fed policy in early 2026, including debates about whether rates would remain “higher for longer,” continues to influence the flow of capital between large-cap growth stocks and smaller, domestically focused companies.
Overall, the interaction between the performance of large caps and the Russell 2000 illustrates the influence of both market sentiment and monetary policy. Investors are increasingly assessing not only overall index gains, but also which sectors and market capitalizations will benefit from the evolving economic environment.
Technical Outlook
The index has decisively broken above the 2,500 level, a key resistance that previously capped small-cap momentum. The Relative Strength Index (RSI) on the daily chart has entered overbought territory, suggesting that the index could experience short-term consolidation or minor pullbacks before continuing its upward trend.
The moving averages, particularly the 50-day and 200-day, have established clear upward slopes, signaling longer-term bullishness. Historically, when Russell 2000 maintains above these averages following a breakout, it often enters extended rallies, albeit with periodic corrections along the way. Support levels are now clearly defined. Immediate technical support lies near 2,450, a level that coincides with previous resistance, and further down near 2,400, where buyers have historically stepped in. On the upside, while the 2,500 breakout opens the path toward 2,650–2,700.
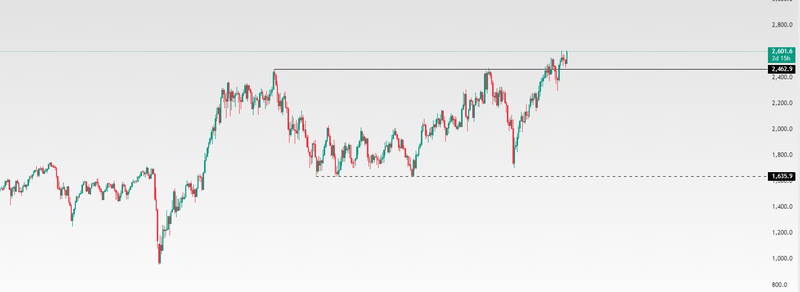
Source: Trading View


