S&P 500 slides as US-EU tensions and Fed independence concerns grow
The S&P 500 index has retreated by more than 2%, driven by mounting anxieties regarding the Federal Reserve’s institutional autonomy and intensifying geopolitical friction between the United States and European nations.

Market participants are closely monitoring the upcoming World Economic Forum in Davos, Switzerland, anticipating pivotal discussions between European heads of state and US President Donald Trump.
Tensions between the US Executive and the Federal Reserve have heightened following Treasury Secretary Scott Bessent’s suggestion that a new Fed Chair could be designated as early as next week by Donald Trump.
While the S&P 500 maintains its long-term bullish trajectory, momentum indicators—specifically the MACD and RSI—signal a strengthening short-term bearish impulse.
S&P 500 retraces amid US-EU geopolitical friction and Fed autonomy risks
The S&P 500 index declined by 2.06% to close at 6,796 points, a move precipitated by escalating geopolitical tensions between the United States and the European Union, compounded by increasing political pressure exerted by the White House on the Federal Reserve.
On the geopolitical front, President Donald Trump has signaled the potential imposition of tariffs on European nations that oppose the proposed US annexation of Greenland. The affected countries include Denmark, Norway, Sweden, France, Germany, the United Kingdom, the Netherlands, and Finland—nations that have deployed troops to Greenland to support the territory’s autonomy. In response to US protectionist threats, the European Union is preparing its "Anti-Coercion Instrument" (ACI). This trade policy framework could see the bloc apply restrictions on the trade of goods and services, limit access to public tenders, and impose constraints on US foreign direct investment (FDI).
Consequently, investors are focusing on the Davos summit in Switzerland, where potential bilateral meetings between European leaders and President Trump may dictate the near-term direction of transatlantic trade relations.
Simultaneously, reports from Reuters and CNBC indicate that Treasury Secretary Scott Bessent has suggested President Trump may decide on the future leadership of the Federal Reserve next week. Such pronouncements have introduced significant uncertainty into the markets, as executive-led pressure on the central bank becomes increasingly overt.
The sustained pressure applied by the US President on Federal Reserve officials—most notably Chairman Jerome Powell and Governor Lisa Cook—has stoked volatility in financial markets. This instability stems from fears that the central bank’s independence may be compromised by political objectives. While the US President advocates for an expansive monetary policy and lower interest rates to mitigate the rising costs of national debt servicing, the Federal Open Market Committee (FOMC) remains committed to its mandate of price stability and maximum sustainable employment.
Technical analysis of the S&P 500 index
From a technical perspective, the S&P 500 index sustains its long-term bullish trajectory, with price action consistently respecting primary moving averages. Key observations include:
- Trend Context: Over the long term, the S&P 500 retains a market structure defined by a sequence of higher highs and higher lows. The index is trading comfortably above its 50, 100, and 200-period moving averages, reinforcing the prevailing bullish sentiment. However, the Moving Average Convergence Divergence (MACD) suggests a gradual loss of momentum, specifically regarding the impulse that originated in the latter half of 2025.
- Resistance Levels: Should short-term resistance at 6,977 (the historical high) be breached, the next significant technical ceiling is situated at 7,000—a prominent psychological level. A decisive move above these markers would indicate potential for further extension into uncharted territory.
- Support Levels: If the short-term support at 6,550 is invalidated, the next critical floor is located at 6,350, coinciding with the 200-period moving average. A breach of this zone would significantly increase the probability of a more profound market correction.
- Momentum Indicators: The MACD exhibits a prolonged bearish divergence, signalling a potential waning of the current trend. Additionally, the Relative Strength Index (RSI) is trending lower, suggesting that the short-term bearish momentum may gain further traction.
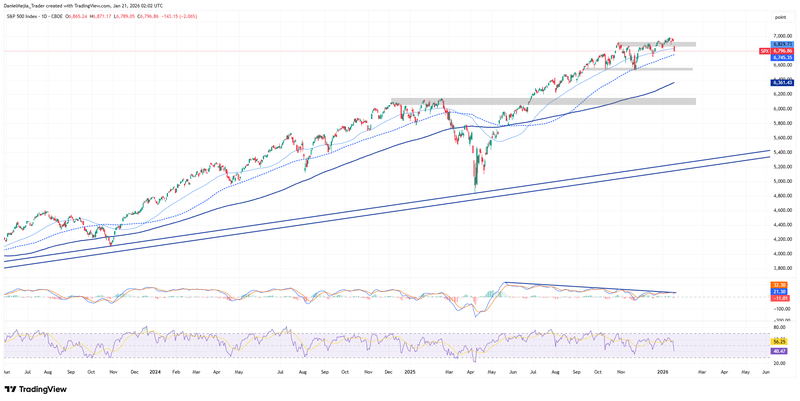
Figure 1. S&P 500 Index (2024-2026). Source: Data from the CBOE; Analysis conducted via TradingView.


