Tesla beats forecasts but shares decline: Financial & technical review
Tesla Inc. has outperformed analyst expectations for total revenue and earnings per share (EPS). However, the share price retreated by over 3% as the automotive segment recorded a year-on-year decline in annual revenue. Current price action suggests mounting pressure within a short-term downward trajectory.

Despite exceeding quarterly revenue and EPS forecasts, Tesla shares closed 3.45% lower as investors reacted to stagnant performance in the core automotive division.
For the full year 2025, Tesla’s total revenue fell by 3%, while earnings per share experienced a significant 31% decline over the same period.
Technical indicators signal an intensifying downward bias that is challenging established bullish patterns in the short term.
Tesla Inc. surpasses forecasts, yet shares retreat amid revenue and income contraction
Tesla reported quarterly revenue of $24.9 billion, marginally ahead of the $24.7 billion consensus, with an EPS of $0.50 exceeding the $0.45 estimate. Consequently, the shares closed down 3.45% at $416.56. This decline is largely attributed to a 6.3% year-on-year (YoY) contraction in the "Automotive" segment, the firm’s primary revenue driver. In contrast, the "Energy Generation and Storage" segment demonstrated robust growth, with a 26% annual increase in 2025. Despite this diversification, the 31% YoY drop in total EPS remains a point of concern for market participants.
Financial analysis of Tesla Inc.
From a fundamental perspective, Tesla has maintained a long-term upward trajectory in total revenue, yet growth has stagnated over the last eight quarters. The YoY revenue growth rate has decelerated since 2022, resulting in a negative performance during the most recent fiscal year. Consequently, net income has been adversely affected, exhibiting a downward trend since 2024.
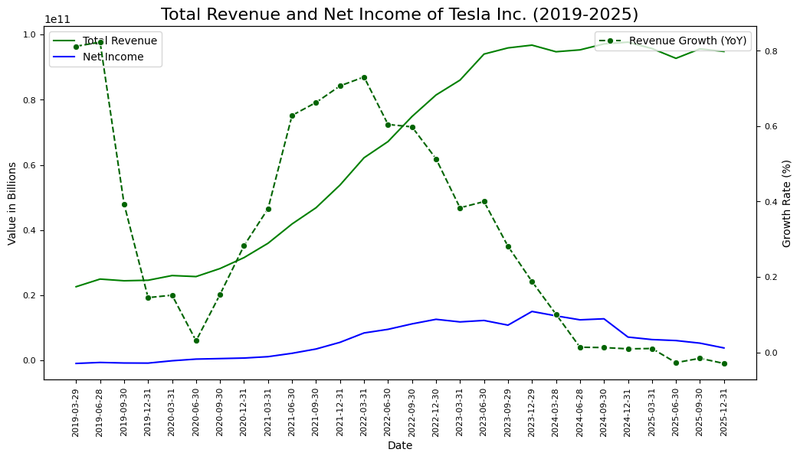
Figure 1. Total revenue, net income, and respective growth rates of Tesla Inc. (2019–2025). Source: Own analysis using data from the Nasdaq Exchange.
As illustrated in Figure 2, Tesla’s net margin has compressed in tandem with the decline in net income. After reaching a peak in Q4 2023, the profit margin narrowed to approximately 4% by the end of 2025.
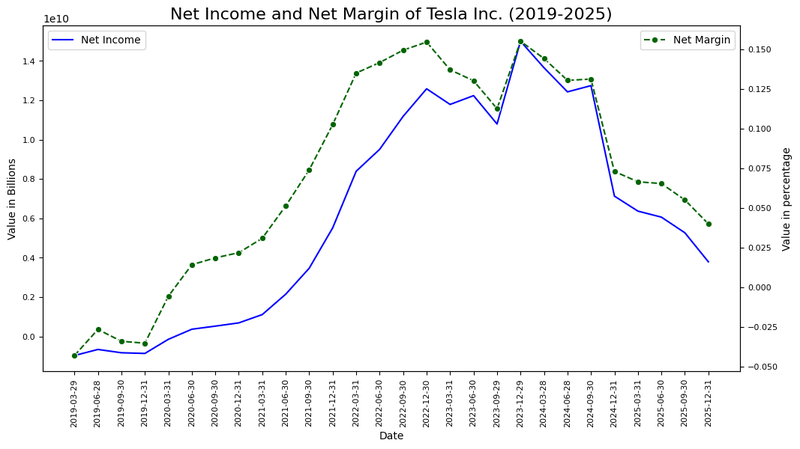
Figure 2. Net margin trend and profitability analysis of Tesla Inc. (2019–2025). Source: Own analysis using data from the Nasdaq Exchange.
Figure 3 highlights a consistent expansion of total assets since 2011, reflecting the firm’s commitment to infrastructure and industrial scale. This expansion has been managed alongside a strategic reduction in leverage; the debt ratio has fallen to a historic low of 6% from its 2018 peak of 46%. In summary, while Tesla continues to accumulate assets and grow its energy business, the stagnation in automotive revenue has impaired net earnings and profit margins.
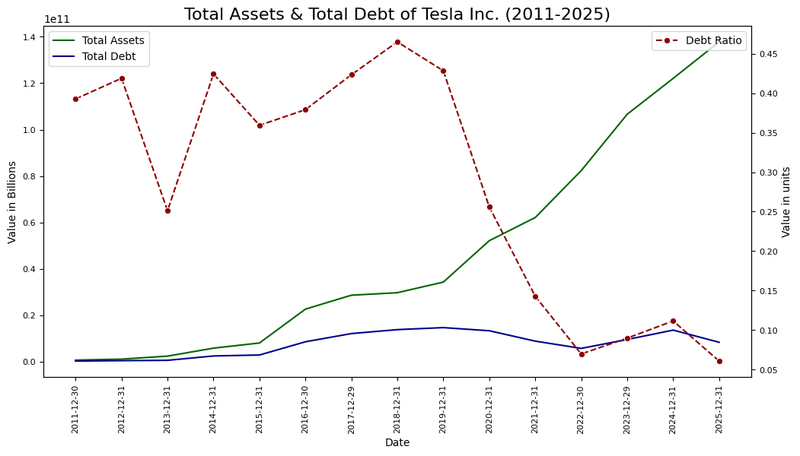
Figure 3. Total assets, total debt, and debt ratio of Tesla Inc. (2012–2025). Source: Own analysis using data from the Nasdaq Exchange.
Technical analysis of Tesla’s share price
Regarding the technical outlook, while Tesla’s share price maintains its primary long-term bullish trajectory, several short-term indicators have pressured to the downside. Key observations include:
- Trend Context: On the long-term, Tesla preserves a market structure of "higher highs" and "higher lows", remaining above the 200-period simple moving average (SMA). However, the price has recently broke the lower boundary of a bullish channel.
- Resistance Levels: Should price action reclaim the short-term resistance at $450—the next significant technical ceiling is the historical peak of $490. A decisive close above this threshold would likely signal a new expansionary phase.
- Support Levels: If the immediate support at $400 is invalidated, the next critical floor is identified at $375. This level coincides with the 200-period SMA. A failure to defend the $375 zone would significantly increase the probability of a deeper market correction.
- Momentum and Volume: The Moving Average Convergence Divergence (MACD) is exhibiting a bearish divergence, suggesting that the prevailing bullish impulse is exhausting. Meanwhile, the Relative Strength Index (RSI) is hovering near neutral levels, suggesting a period of consolidation may precede the next major move.
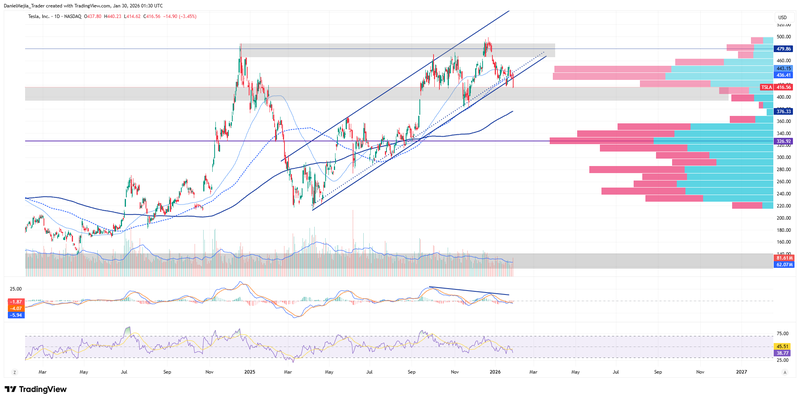
Figure 4. Tesla’s share price performance and technical indicators (2024–2026). Source: Data from the Nasdaq Exchange; Own analysis conducted via TradingView.


