Tesla nears record high despite overvaluation concerns
Tesla is approaching its record high amidst a constant growth rate in the company’s revenue; however, relative valuation analysis signals that price ratios remain at elevated levels.

In the third quarter, Tesla achieved a revenue growth rate of 11.5 per cent (YoY), whereas Earnings Per Share (EPS) decreased by 30 per cent over the same period.
Tesla's Price-to-Earnings (PER) ratio is approximately 313x, significantly higher than the industry average of 12x.
The Price-to-Book (P/B) ratio for Tesla stands at approximately 19x, compared to an industry average of 1.4x.
Tesla’s trend demonstrates consistent bullish performance; however, should market volatility increase, the shares could be adversely impacted given the Beta is close to 2x.
Tesla nears its historical high, but overvaluation concerns persist
The price of Tesla shares has approached its record high, closing slightly below that critical zone. At current levels, the automotive company has reached a market capitalisation of $1.58 trillion; consequently, the firm has become the ninth most relevant company within the S&P 500 index and one of the most valuable firms globally.
In the third quarter, the enterprise achieved a year-on-year growth rate of 11.5 per cent in total revenue (reporting $28.09 billion). In contrast, Earnings Per Share (EPS) declined by 30 per cent to $0.50.
This elevated market capitalisation combined with lower earnings implies that the company trades at a Price-to-Earnings (PER) ratio of approximately 313x. Furthermore, the Price-to-Book ratio is approximately 19x. These represent highly elevated ratios when compared to the industry averages, which stand close to 12x and 1.4x respectively (according to data from Investing.com).
Although the company is a global reference point for the electric automotive industry, its revenue dependence on the United States and China implies that growth rates in 2024 and 2025 have been impacted, generating a period of stabilisation while valuation ratios have expanded to current levels.
Market participants are assigning value based on a possible recovery of the US and Chinese economies, driving the market cap close to its record high. However, concerns regarding overvaluation could affect the firm’s shares if market risk increases due to economic and political uncertainty in the United States. In addition, Tesla's Beta is close to 2.09—according to Investing.com data—indicating a high sensitivity to the broader market.
Technical analysis of Tesla’s shares.
From a technical perspective, Tesla’s shares remain within a long-term bullish pattern. Key observations include:
- Trend context. In the long term, Tesla shares remain inside a bullish channel pattern and continue to respect long-term moving averages (50, 100, and 200 periods).
- Resistance levels. Should the resistance at $479.86 (historical high) be breached to the upside, the next relevant ceiling is $500 (a significant psychological level). A decisive break above these levels would suggest the potential for an extension into higher price zones.
- Support levels. If the support at $400 (a structural support and the lower boundary of the bullish channel) is broken to the downside, the next relevant floor is $350 (a level proximate to the 200-day moving average). A loss of the $350 zone would increase the probability of a deeper correction.
- Momentum indicators. The MACD is hovering near the neutral level, implying that the bullish momentum does not currently exhibit weakness. Meanwhile, the ATR indicator is declining, although the average level remains slightly above its historical performance.
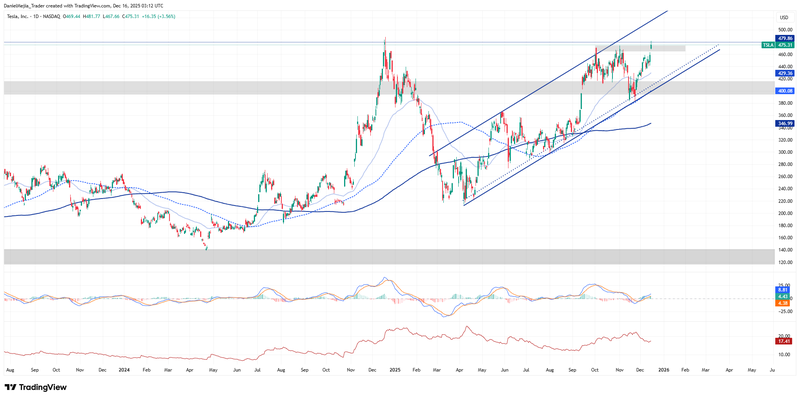
Figure 1. Tesla’s shares (2024-2025). Source: Data from the Nasdaq Exchange; Own analysis conducted via TradingView.


