UK inflation holds steady, but high energy prices pose rebound risks
The British pound depreciated against the US dollar as concerns regarding persistent inflationary risks intensified. This movement occurs as the Bank of England (BoE) continues to balance the necessity of curbing high prices against a cooling labour market.

The UK headline inflation rate held steady at 3.0% in February; however, the core inflation rate—which excludes volatile energy and food prices—accelerated from 3.1% to 3.2%.
The Bank of England is navigating a precarious economic environment characterised by stubborn price pressures, rising energy costs, and a labour market that is beginning to signal a loss of momentum.
The GBP/USD pair fell 0.37% to 1.3360, currently trading within a consolidative range that reflects prevailing economic uncertainty and a lack of directional conviction among investors.
UK inflation rate remains unchanged, staying above the BoE’s target
According to the latest data from the Office for National Statistics (ONS), the UK inflation rate remained unchanged in February at 3.0%, aligning with market consensus. In contrast, the core inflation rate—which strips out volatile components such as energy and food—unexpectedly accelerated from 3.1% to 3.2%, surpassing analysts' forecasts of a neutral reading.
The Bank of England is currently navigating a fraught economic landscape defined by elevated inflation and a cooling employment sector. UK inflation levels remain among the highest in the Western world and are significantly above the BoE’s 2% mandate. Simultaneously, the labour market is exhibiting signs of strain; the unemployment rate has reached 5.2%—its highest level since February 2021—while job vacancies have continued a decelerating trend observed over the past three years.
Furthermore, the United Kingdom and its European counterparts remain highly sensitive to geopolitical instability due to their significant dependence on energy imports, particularly oil and natural gas. The ongoing tensions involving the US, Israel, and Iran in the Middle East have heightened fears of an inflationary rebound, driven by a sharp increase in global energy prices over the last month. During its most recent monetary policy meeting, the BoE reiterated its readiness to implement further restrictive measures should price instability remain elusive.
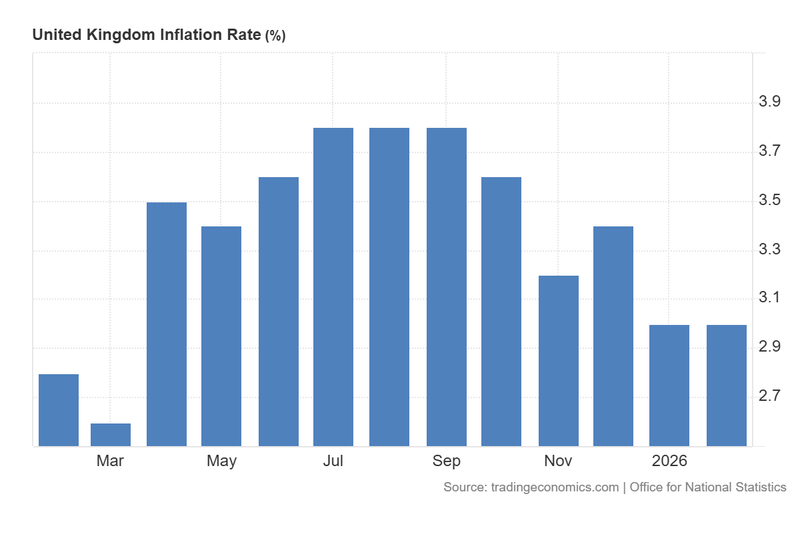
Figure 1. United Kingdom Inflation Rate (2025–2026). Source: Data from the Office for National Statistics; Figure obtained from Trading Economics.
Technical analysis of the GBP/USD pair
From a technical perspective, the GBP/USD pair continues to trade within a well-defined long-term bullish channel. However, the immediate market structure suggests a weakening of this momentum:
- Trend Context: While the long-term trajectory of the British pound remains technically bullish, the price is currently trading below its 50, 100, and 200-period Simple Moving Averages (SMAs). In the short term, the pair is oscillating within a consolidative range, reflecting a lack of definitive directional momentum as market participants await fresh fundamental catalysts.
- Resistance Levels: Should the pair breach immediate resistance at 1.3540, the next significant ceiling is identified at 1.3670 (a structural resistance). A decisive close above this level would signal a potential extension into higher price territory and a resumption of the primary trend.
- Support Levels: If the short-term support at 1.3260 is invalidated, the next critical floor is located at 1.3060, which represents the lower boundary of the current ascending channel. A breach of the 1.3060 zone would significantly heighten the probability of a broader trend reversal or a deeper market correction.
- Momentum Indicators: Both the Moving Average Convergence Divergence (MACD) and the Relative Strength Index (RSI) are positioned in neutral territory. Nevertheless, the downward trajectory of both indicators suggests that bearish pressure is gradually mounting within the current consolidation phase.
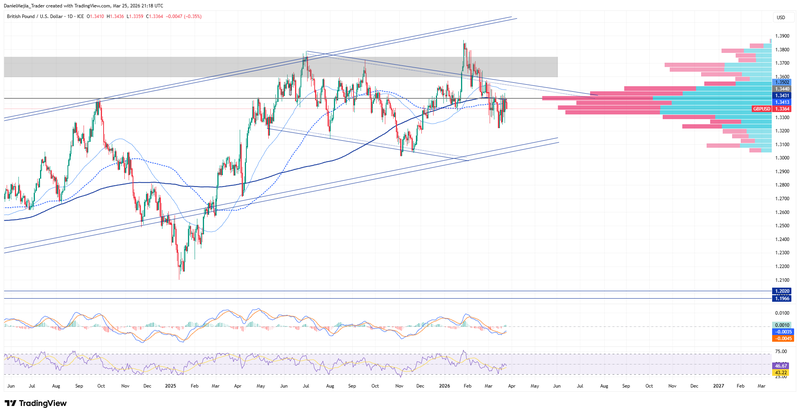
Figure 2. GBP/USD pair (2024–2026). Source: Data from the Intercontinental Exchange (ICE); own analysis conducted via TradingView.


