US new home sales drop sharply; Nasdaq retreats amid uncertainty
The Nasdaq 100 index declined following a significant contraction in US new home sales and mounting concerns regarding escalating energy costs. These factors have intensified fears that central banks may maintain a restrictive monetary policy stance for longer than previously anticipated.

US new home sales experienced a prominent 17.6% decline in January, reaching their lowest level in over a decade.
Global energy prices continue to appreciate as geopolitical tensions in the Middle East intensify, presenting a renewed inflationary risk.
While the Nasdaq maintains its primary long-term bullish trend, it is currently testing critical support levels. Meanwhile, short-term momentum indicators, including the MACD and RSI, are signalling increased downward pressure.
US new home sales fall to lowest level since 2013 as equities retreat
According to data released by the US Census Bureau, new home sales reached their lowest monthly volume since July 2013, plummeting by 17.6% in January. On a consolidated basis, the indicator fell from 0.712 million in December to 0.587 million in January—significantly missing analyst forecasts of 0.72 million. This downturn may be attributed to two primary factors: the ascent of long-term interest rates throughout January and deepening concerns regarding the broader US economic outlook. Although the January data does not yet account for the spike in energy prices observed in March, the impact of these rising costs will be a critical component of forthcoming housing assessments.
Concurrently, the Nasdaq index fell by 0.29% to 24,335 points. Investor sentiment was dampened by the intensification of conflict in the Middle East, which has driven energy prices higher. Consequently, Western central banks are signalling a potential shift in their monetary policy trajectories, suggesting further restrictive measures may be necessary if inflationary pressures persist. Technology companies remain particularly sensitive to a high-interest-rate environment, as increased borrowing costs directly impact the financing of capital-intensive growth projects.
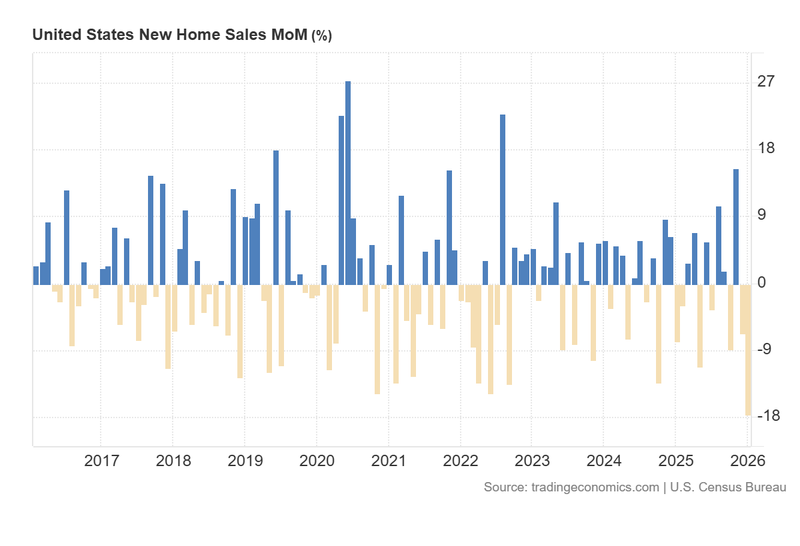
Figure 1. US New Home Sales MoM (2016–2026). Source: Data from the US Census Bureau; Figure obtained from Trading Economics.
Technical analysis of the Nasdaq index
From a technical perspective, the Nasdaq index preserves its long-term bullish trajectory, although it is currently navigating a period of consolidation. Key observations include:
- Trend Context: In the long term, the Nasdaq retains a bullish market structure characterised by a sequence of higher highs and higher lows. However, over the past four months, the index has transitioned into a horizontal range-bound pattern.
- Resistance Levels: Should the index breach the current resistance at 26,100 (its historical peak), the next significant ceiling is identified at 27,000—a major psychological threshold. A decisive break above these levels would suggest a continuation of the primary uptrend.
- Support Levels: If the immediate support at 24,000 is invalidated, the next critical structural floor is located at 22,000. A breach of the 22,000 zone would significantly increase the probability of a more profound market correction.
- Momentum Indicators: Both the Moving Average Convergence Divergence (MACD) and the Relative Strength Index (RSI) are exhibiting lower highs. This bearish divergence suggests that the prevailing bullish momentum may be losing strength in the near term.
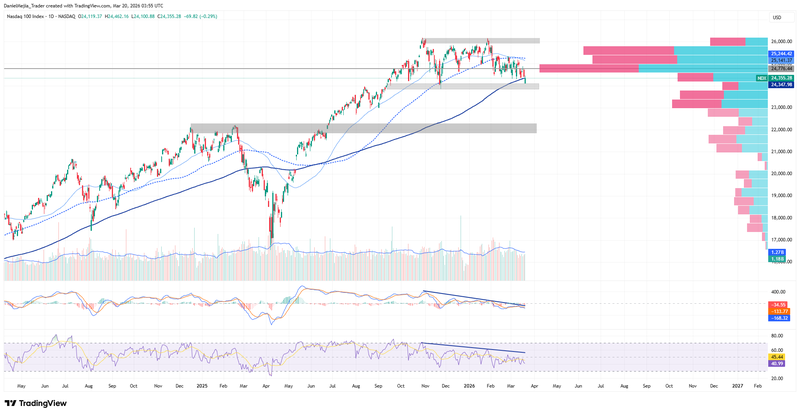
Figure 2. Nasdaq index (2024–2025). Source: Data from the Nasdaq Exchange; own analysis conducted via TradingView.


