Yen weakens as financial uncertainty grows ahead of Japan’s Lower House election
The Japanese yen is currently navigating conflicting pressures between a government seeking to accelerate economic growth and a central bank attempting to anchor inflationary expectations. Consequently, the Japanese currency is once again approaching the critical ¥158 zone.

The yen has depreciated amid significant political and financial uncertainty. Investors are closely monitoring the upcoming lower house election this Sunday, where the incumbent government seeks a stronger mandate to pursue its growth-oriented economic agenda.
Financial instability is becoming a primary concern; a further sharp depreciation in the yen could trigger significant liquidation in the domestic bond market.
Reflecting this heightened uncertainty, 10-year Japanese Government Bond yields are currently trading around the 2.22% mark—a five-year high.
The USD/JPY pair is reclaiming its medium-term bullish trajectory, with price action trending toward historical resistance near the ¥159 level.
Japanese yen ensnared by electoral uncertainty and financial stability concerns
The Japanese yen remains under significant pressure ahead of the lower house elections, as concerns mount regarding the financial health of the credit markets in Asia’s second-largest economy. On 8 February, Japan will head to the polls. Prime Minister Sanae Takaichi is seeking to broaden her legislative support to implement a policy suite focused on aggressive economic growth driven by increased public expenditure. However, market participants remain wary that the proposed fiscal incentives could exacerbate inflationary pressures.
As a result, 10-year Japanese Government Bond yields reached 2.22%—their highest level in five years—as investors anticipate a more restrictive (hawkish) stance from the Bank of Japan (BoJ) to curb rising prices. Amidst this backdrop, yen holders have engaged in substantial selling. The scale of the yen's depreciation has been so pronounced that rumours of a potential joint intervention by Japanese and US authorities have surfaced. Such a move would aim to defend the ¥159 psychological level and prevent a prominent liquidation in the bond markets of both nations.
Despite a temporary reprieve in selling pressure over the past fortnight, renewed strength in the US dollar has pushed the USD/JPY pair back to the ¥157.18 level.
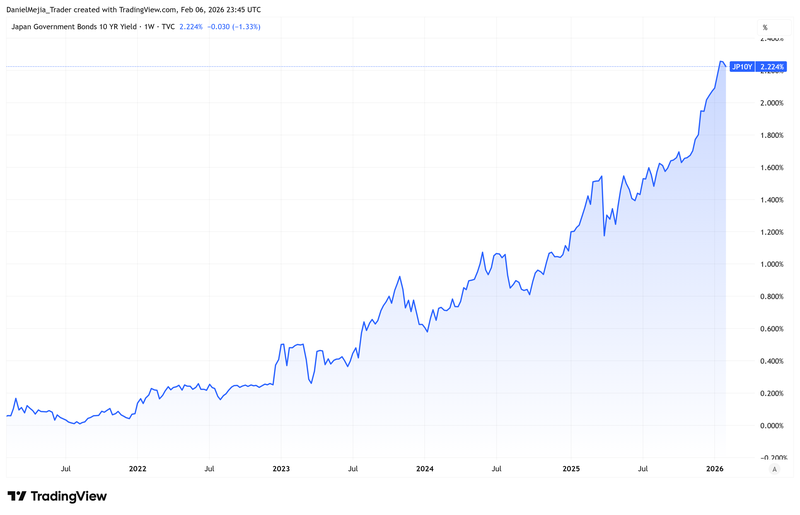
Figure 1. Japan Government Bonds 10Y Yield (2021-2026). Source: Figure obtained from TradingView.
Technical analysis of the USD/JPY pair
From a technical perspective, the USD/JPY pair continues to respect its medium-term bullish momentum. Key observations include:
- Trend Context: In the long term, the pair remains within a broad consolidation pattern, reflecting deep-seated market indecision. Conversely, the medium-term trend is technically bullish, characterised by a sequence of "higher highs" and "higher lows," with prices maintaining a position above the 50, 100, and 200-period Simple Moving Averages (SMAs).
- Resistance Levels: If short-term resistance at ¥159 is breached to the upside, the next significant technical ceiling is the relevant peak of ¥161.50. A decisive break above this level would signal a potential extension into higher territory.
- Support Levels: Should the short-term support at ¥152 fail—a critical zone where an ascending trend line, the 200-period SMA, and horizontal support converge—the next structural floor is located at ¥147. A breach of the ¥147 zone would significantly increase the probability of a deeper market correction.
- Momentum Indicators: Both the Moving Average Convergence Divergence (MACD) and the Relative Strength Index (RSI) are currently oscillating within neutral zones. This behaviour underscores the prevailing uncertainty; consequently, the next major directional shift in the USD/JPY pair will likely be dictated by fundamental developments.
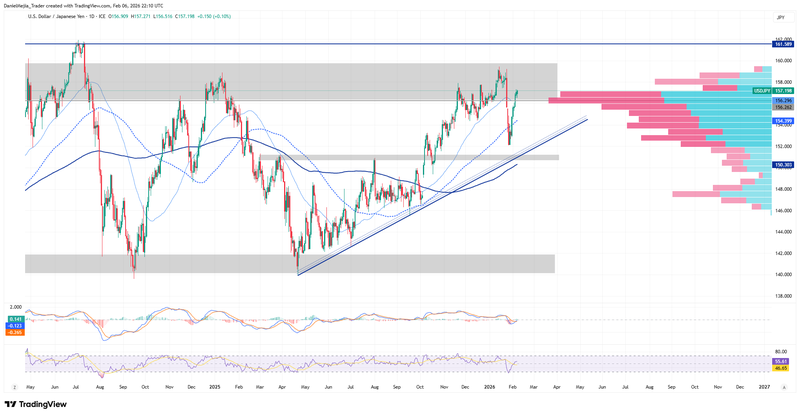
Figure 2. USD/JPY Pair (2024-2026). Source: Data from the Intercontinental Exchange (ICE); Own analysis conducted via TradingView.


