Fair Value Gap (FVG): The Complete Guide for ICT Traders
In ICT methodology, one of the most powerful and frequently used concepts is the fair value gap (FVG). It represents an imbalance in price action, a moment when the market moves too quickly in one direction, leaving behind inefficiency and unfilled liquidity that price often returns to rebalance. Understanding how FVGs work is essential for identifying high-probability entries, predicting retracements, and reading institutional order flow.

Liquidity magnet.
Market seeks efficiency.
Higher timeframe = higher probability.
Why FVGs matter
After a BOS (Break of Structure) or MSS (Market Structure Shift), price often returns to an FVG before continuing the trend or even before reversing it. A strong displacement candle that creates an FVG signals institutional order flow. Many ICT entry models (BOS entry, MSS reversal entry, rejection-block entries) rely on rebalancing the imbalance left behind by strong momentum — which is exactly what FVGs represent. Liquidity logic the market seeks efficiency. Imbalances attract price until the inefficiency is filled.
Types of FVGs
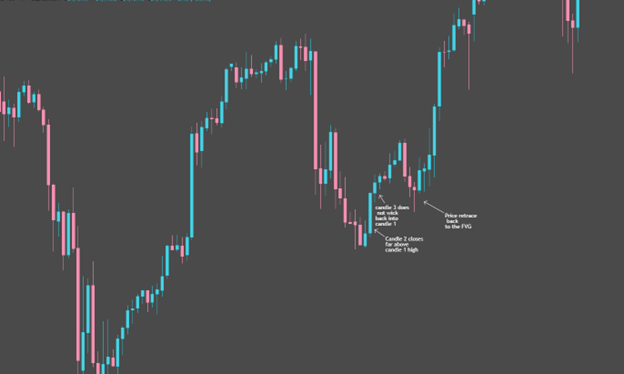
1. Bullish FVG
Occurs when prices move up aggressively:
Candle 2 closes far above Candle 1 high. Candle 3 does not wick back into Candle 1 high. When A and B occur, a bullish imbalance is formed. Price often retraces back into the FVG before continuing higher. When BOS or MSS appears, the high-probability entry is usually the retracement back into the FVG.
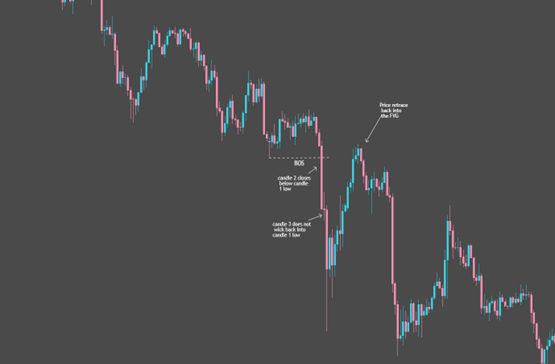
2. Bearish FVG
Occurs when prices move down aggressively:
Candle 2 closes far below Candle 1 low. Candle 3 does not wick back into Candle 1 low. Price often retraces back into the FVG before continuing lower. After BOS or MSS, the retracement back into the FVG becomes the high-probability entry.
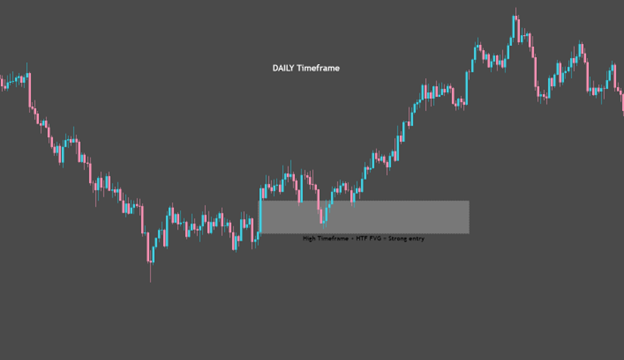
Weekly / daily / higher-timeframe FVGs
Higher-timeframe FVGs act as major magnets for price and strongly influence lower-timeframe setups.
HTF FVGs = strong + reliable + high probability
How FVGs form: example
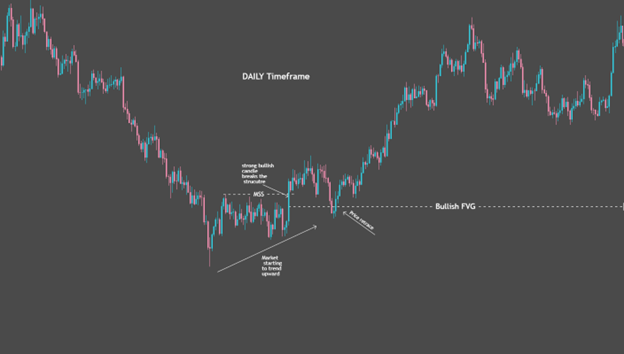
A. Bullish scenario:
- The market is trending upward.
- A strong bullish displacement candle breaks structure.
- This candle leaves an imbalance between the high of Candle 1 and the low of Candle 3.
- Price later retraces into the FVG.
B. Bearish scenario:
- The market is trending downward.
- A strong bearish displacement candle breaks structure.
- This candle leaves an imbalance between the low of Candle 1 and the high of Candle 3.
- Price later retraces into the FVG.
How traders use FVG
Retracement entries
After BOS or MSS, traders wait for price to return to the FVG as the ideal entry zone.
Target areas
FVGs act as magnets; if price moves toward an imbalance, it often seeks to fill it.
Confluence with liquidity
The best setups occur when FVG aligns with:
- liquidity grabs
- break of structure
- order blocks
- premium/discount zones
Trend continuation
In strong trends, price moves from one FVG to the next like “stepping stones.”
Rules for a valid FVG
- The middle candle must be wide-range and impulsive.
- Candles 1 and 3 must not overlap.
- It should occur during displacement after taking liquidity.
- Ideally appears with a BOS or MSS event.
Fair Value Gaps are more than just price inefficiencies, they are footprints of institutional order flow. By mastering how to identify, validate, and trade FVGs, you gain precision in entries, better directional bias, and a deeper understanding of price delivery.
FQAs
What is a Fair Value Gap (FVG)?
A Fair Value Gap (FVG) is an area on a price chart where a gap forms between candles. It indicates a market imbalance caused by rapid price movement. This gap represents untraded price levels created by strong buying or selling pressure.
How to identify a bullish fair value gap (Bullish FVG)?
A bullish FVG appears in an uptrend when the low of the third candle is higher than the high of the first candle, leaving a gap in between. This gap often acts as a potential retracement zone before the price continues moving upward.
How to identify a bearish fair value gap (Bearish FVG)?
A bearish FVG appears in a downtrend when the high of the third candle is lower than the low of the first candle, creating a gap. This gap may serve as a retracement zone before the price resumes its downward movement.


