How to trade the shooting star pattern
The shooting star candlestick pattern is a bearish reversal signal that appears after an uptrend, indicating potential price declines.
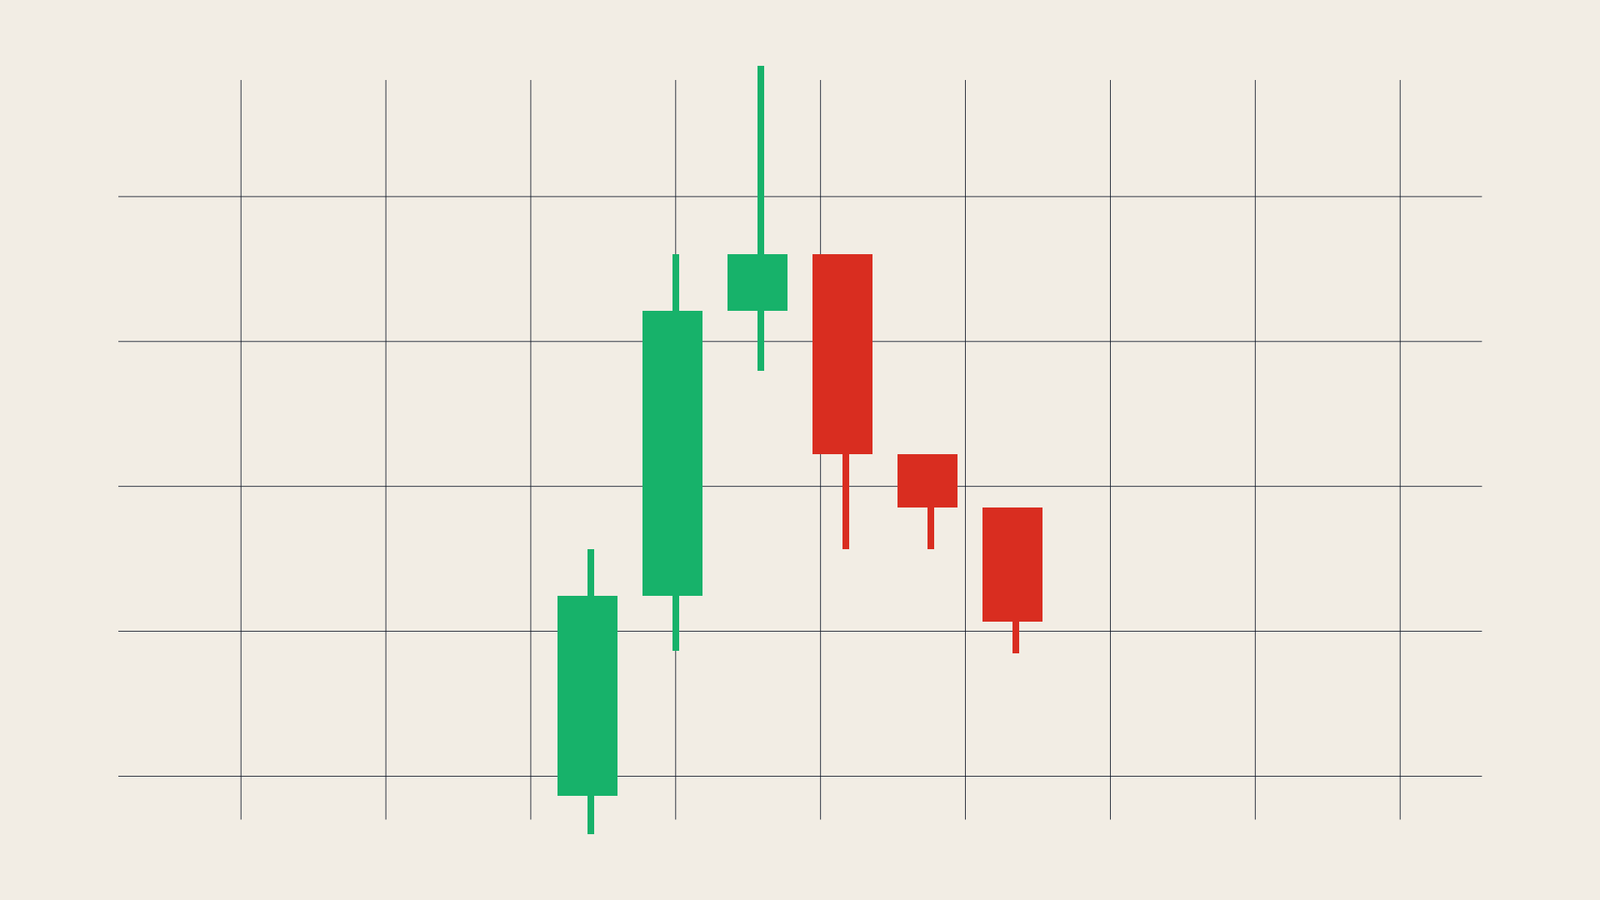
Appears after an uptrend, signaling a possible bearish reversal.
Characterized by a small real body near the session's low and a long upper shadow.
Indicates that buyers pushed prices higher, but sellers regained control by the close.
Requires confirmation through subsequent bearish price action.
Understanding the shooting star pattern
The shooting star candlestick pattern is a single-candle formation that typically occurs at the top of an uptrend. It features a small real body near the session's low, a long upper shadow, and little to no lower shadow. This structure suggests that buyers attempted to push prices higher, but sellers overwhelmed them, driving the price back down by the close.
Psychology behind the pattern
The formation of a shooting star reflects a shift in market sentiment:
- During an uptrend, buyers are in control, pushing prices higher.
- A new session opens, and buyers continue to drive prices upward, creating a long upper shadow.
- However, selling pressure increases, and sellers push the price back down near the opening level by the close.
This price action indicates that the uptrend may be losing momentum, and a reversal could be imminent.
Confirming the shooting star
Before acting on a shooting star pattern, traders should seek confirmation through additional bearish signals:
- A subsequent candle that closes below the shooting star's real body.
- High trading volume during the formation of the shooting star.
- Overbought readings from technical indicators like the Relative Strength Index (RSI).
- The pattern forming near a known resistance level.
Confirmation helps reduce the likelihood of false signals and increases the pattern's reliability.
Trading strategies for the shooting star
Once confirmation is obtained, traders can consider the following strategies:
- Entry Point: Initiate a short position when the price falls below the shooting star's low.
- Stop-Loss: Place a stop-loss order above the shooting star's high to manage risk.
- Profit Target: Set a profit target at a previous support level or use a risk-reward ratio of at least 2:1.
It's essential to combine the shooting star pattern with other technical analysis tools to enhance decision-making.
Variations and considerations
- Red vs. Green Shooting Star: The color of the shooting star's real body (red or green) is less important than its position and structure. Both indicate potential bearish reversals.
- Timeframes: While the pattern is most reliable on daily charts or higher, it can also be observed on shorter timeframes, though with increased risk of false signals.
- Market Context: The pattern's significance increases when it appears after a prolonged uptrend or near significant resistance levels.
The shooting star candlestick pattern serves as a valuable tool for traders to identify potential bearish reversals after an uptrend. However, it's crucial to seek confirmation through additional technical indicators and price action before making trading decisions. By integrating the shooting star pattern into a comprehensive trading strategy, traders can enhance their ability to anticipate market shifts and manage risk effectively.
Frequently Asked Questions (FAQs)
Can a green shooting star be bearish?
Yes, the color of the shooting star's real body doesn't affect its bearish implication. The pattern's structure and position are more critical.
Is the shooting star pattern reliable on intraday charts?
While it can appear on intraday charts, the pattern is generally more reliable on daily charts due to reduced market noise.
How does volume affect the shooting star's reliability?
Higher trading volume during the formation of the shooting star increases the pattern's validity as it indicates stronger selling pressure.
Should I use other indicators with the shooting star pattern?
Yes, combining the shooting star with other technical analysis tools like RSI, MACD, or support/resistance levels can improve trading decisions.
