How to trade using pivot points
Pivot trading is built around one simple idea: markets tend to react around predefined price levels. These levels called pivot points are calculated in advance and used to anticipate where price might stall, reverse, or accelerate.

Pivot trading is a method in technical analysis built around the idea that markets tend to react at predefined price levels.
The central pivot point is more than just a calculation; it acts as a reference point for market sentiment.
While the standard or “floor” pivot points are the most widely used, several variations exist, each designed with a slightly different emphasis.
What is pivot trading
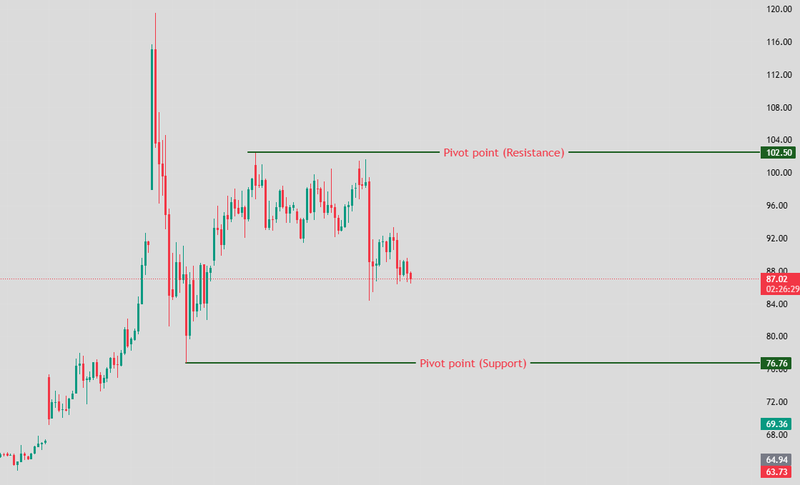
Pivot trading is a method in technical analysis built around the idea that markets tend to react at predefined price levels. These levels, known as pivot points, are calculated before the trading session begins and are used to anticipate where price may stall, reverse, or accelerate. Rather than reacting emotionally to price movements, traders using pivot points approach the market with a structured plan, already knowing the key zones that matter.
At its core, pivot trading is about identifying potential turning points and areas of balance in the market. These levels act as a roadmap, helping traders understand where buyers or sellers are more likely to step in.
Source: Trading View
How pivot points are calculated
Pivot points are derived from the previous trading period, most commonly the prior day’s high, low, and closing prices. The central pivot point represents the average of these three values, making it a reflection of the market’s recent equilibrium.
High + Low + Close / 3
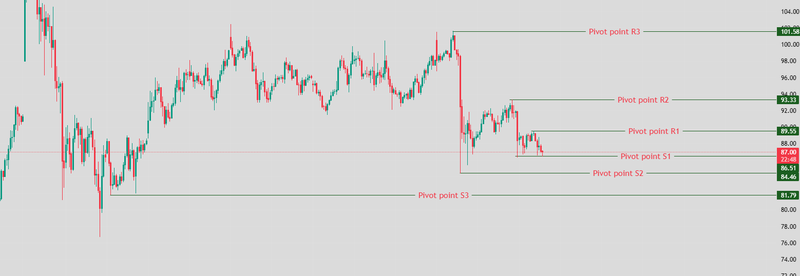
From this central value, additional support and resistance levels are calculated using the previous period’s range. This creates a structured set of levels above and below the current price, typically labeled as resistance (R1, R2, R3) and support (S1, S2, S3). Each level represents a potential zone where price may react, either by reversing or continuing its movement.
The timeframe used for calculation depends on the trader’s approach. Intraday traders usually rely on daily pivots, while swing traders may use weekly levels, and longer-term participants may refer to monthly pivots
Source: Trading View
Understanding the central pivot as market bias
The central pivot point is more than just a calculation; it acts as a reference point for market sentiment. When price trades above the pivot, it suggests a bullish environment where buyers have the upper hand. When price is below it, the tone shifts to bearish, indicating selling pressure dominates.
This simple distinction helps traders frame their decisions. Instead of constantly questioning direction, they can use the pivot as a guide, favoring long positions above it and short positions below it. In this way, the pivot becomes a filter that aligns trades with the broader intraday trend.
The structure of pivot levels
The full set of pivot levels creates a layered structure around price. The central pivot sits in the middle, with resistance levels stacked above and support levels below. These levels are not arbitrary; they are derived mathematically from the prior period’s range, which reflects volatility and price expansion.
As price moves through these levels, each one can act as a barrier or steppingstone. The first levels (R1 and S1) are typically the most frequently tested, while the outer levels (R2, R3, S2, S3) come into play during stronger market movements. This structure allows traders to anticipate how far price might travel under different conditions, giving them a clearer sense of both opportunity and risk.
Practical trading approaches using pivots
In real market conditions, pivot points are commonly used in two distinct ways. The first approach assumes that price will respect these levels. When price approaches a support or resistance level and shows signs of hesitation or rejection, traders may anticipate a reversal. This is often seen in quieter or range-bound markets where price oscillates between levels.
The second approach focuses on momentum. When price breaks through a pivot level with strength, it can signal continuation toward the next level. In this case, the level that was broken often becomes a new support or resistance zone. Traders look for confirmation through strong price action or increased activity, as this helps filter out false breakouts.
Both approaches rely on context. A calm market favors reversals, while a trending or volatile market tends to reward breakout strategies. Understanding the environment is just as important as the levels themselves.
Risk management around pivot levels
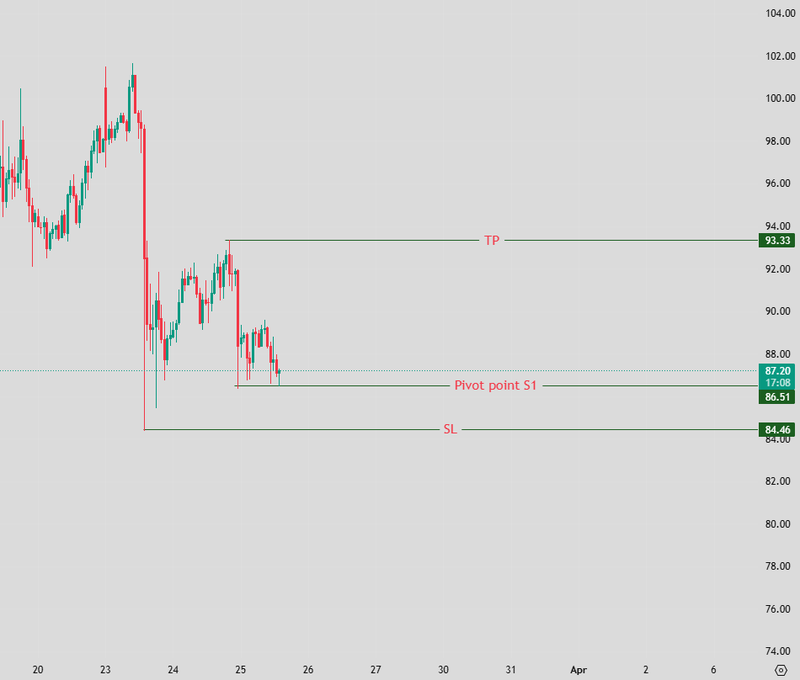
Pivot points naturally support disciplined risk management because they define clear boundaries. When entering a trade near a pivot level, traders often place their stop-loss just beyond that level, allowing for small fluctuations while protecting against larger adverse moves.
Profit-taking is also structured around pivots. Instead of guessing where to exit, traders can use the next level as a logical target. For example, a move from the central pivot toward the first resistance provides a clear objective, and further levels can be used for scaling out of positions. This approach creates consistency and helps maintain a favorable balance between risk and reward.
Source: Trading View
Different types of pivot points
While the standard or “floor” pivot points are the most widely used, several variations exist, each designed with a slightly different emphasis. Fibonacci pivots incorporate retracement ratios, making them appeal in trending markets. Woodie’s pivots give more weight to the closing price, which some traders believe better reflects market sentiment. Camarilla pivots offer tighter levels and are often used for short-term mean-reversion strategies, while DeMark pivots adjust their calculations based on market direction.
The choice between these types depends largely on trading style and market conditions. Many traders begin with standard pivots due to their simplicity and broad acceptance, then explore alternatives as they refine their approach.
FQAs
Are pivot points good for day trading?
Yes, pivot points are especially popular in day trading because they provide fixed levels for the entire session. This allows traders to plan entries, exits, and risk levels in advance without relying on constantly changing indicators.
What is the difference between support and resistance in pivot trading?
Support levels (S1, S2, S3) are areas where price may stop falling and bounce upward, while resistance levels (R1, R2, R3) are zones where price may stall or reverse downward. These levels help traders anticipate market reactions.
Do pivot points work in all markets?
Pivot points can be used in forex, stocks, commodities, and cryptocurrencies. However, they tend to work best in highly liquid markets where many traders are watching the same levels, increasing their effectiveness.
What is the best timeframe for pivot trading?
The best timeframe depends on your trading style. Intraday traders typically use daily pivot points, while swing traders may rely on weekly or monthly pivots. The key is to match the pivot timeframe with your trading horizon.
What are the main pivot trading strategies?
The two most common strategies are reversal trading, where traders expect price to bounce off pivot levels, and breakout trading, where traders look for strong moves beyond a level toward the next one. Both approaches require confirmation to reduce false signals.


