Rising wedge pattern: how to identify and Trade It
The rising wedge is a bearish chart formation that reflects fading buying pressure and often signals that an uptrend or rally may be nearing its end.

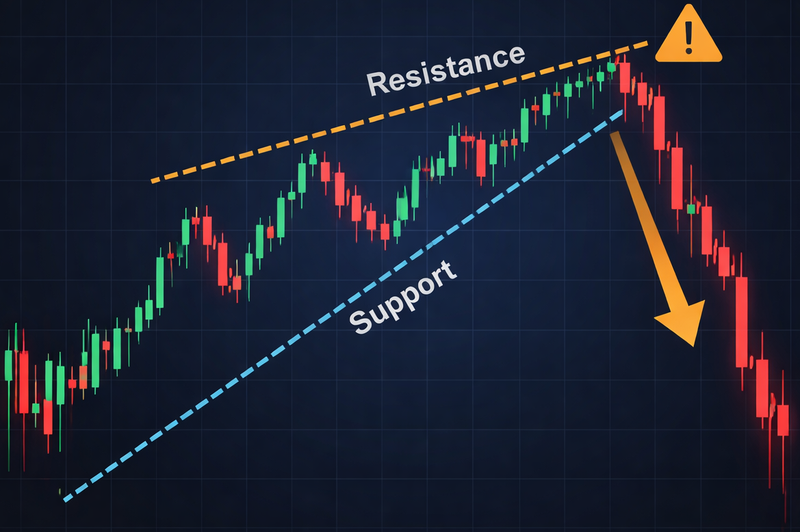
The rising wedge is a bearish reversal or continuation pattern that forms while prices are rising.
It’s characterised by two upward-sloping trendlines that gradually converge.
The pattern is confirmed when the price breaks below the lower support line.
Price targets are typically estimated using the height of the wedge at its widest point.
What the rising wedge pattern is
A rising wedge forms when price continues to make higher highs and higher lows, but the upward move loses strength as the range narrows. Both trendlines slope upward, yet the lower trendline rises faster than the upper one. This compression reveals a critical imbalance: price is climbing, but momentum is fading. In technical analysis, that divergence often precedes a downside break.
Market psychology behind the pattern
Early in the wedge, buyers remain in control and push price higher. As the structure develops, each new high delivers less follow-through, while pullbacks become more frequent. Buyers are still active, but conviction is thinning. Sellers don’t need to overpower demand; they only need to wait for it to weaken. When support finally gives way, trapped longs and late buyers accelerate the drop.
Where it appears and why context matters
Rising wedges typically show up in two environments.
- After a strong rally: acting as a bearish reversal at market tops.
- Within a downtrend: acting as a bearish continuation during corrective rebounds.
Context is crucial. A rising wedge that breaks lower in the direction of the higher-timeframe trend tends to be more reliable than one that forms against it.
How to identify a valid rising wedge
Start by drawing two upward-sloping, converging trendlines that contain price action. A quality wedge usually has at least five touches across both lines. The angle of ascent should slow over time, not accelerate. Volume often contracts during the pattern, reinforcing the idea that buying interest is drying up. If volume expands aggressively during the rise, the structure may be a trend channel rather than a wedge.
Confirmation: the breakdown
A rising wedge is not complete until price breaks and closes below the lower trendline. Intraday spikes are not enough; confirmation comes from a clear close with follow-through. In forex markets, where centralized volume is limited, confirmation often shows up as range expansion and strong downside momentum immediately after the break.
Trading the rising wedge
Entry:
- Conservative: sell after a confirmed close below the lower trendline.
- Aggressive: sell a retest of the broken trendline from below.
Stop-loss:
- Common placement is above the most recent swing high inside the wedge, or just above the upper trendline with a small buffer.
Targets:
- Measure the widest part of the wedge and project that distance downward from the breakdown point.
- Additional targets often align with prior support zones or psychological price levels.
Because false breaks can occur near the wedge’s apex, disciplined position sizing and patience are essential.
Common mistakes to avoid
A frequent error is selling too early, before support actually breaks. Another is ignoring the broader trend—counter-trend wedges need stronger confirmation. Traders also underestimate volatility near the apex, where price can whipsaw before choosing direction.
The rising wedge is a warning, not a trigger. Let price compress, wait for a decisive breakdown, define risk above structure, and target measured moves. When it aligns with broader bearish conditions, the rising wedge can mark some of the cleanest downside setups in technical analysis.
FAQs
Is the rising wedge bullish or bearish?
Bearish; it signals weakening buying pressure.
When is it confirmed?
On a clear close below the lower trendline.
Where should the stop go?
Above the latest swing high or upper trendline.
How do I set targets?
Project the wedge’s widest height downward from the break.


