What is an Exponential Moving Average (EMA) and how do traders use it?
The exponential moving average (EMA) is a smoothing indicator that follows price but reacts more quickly than a simple moving average. Traders use it to read trend direction, plan entries, and mark dynamic support and resistance on stocks, currency pairs, crypto, and futures.

EMA places greater weight on the most recent price data.
It moves quicker than a simple moving average.
Traders look for signals from EMA crossovers and the EMA “zone.”
Always apply risk rules, as EMAs can create whipsaws in sideways markets.
What the EMA means
When people ask “what is EMA in trading?”, they’re asking about a line that follows price while filtering noise. The exponential moving average emphasizes the latest candles, so it turns quicker when momentum changes. That responsiveness helps short-term traders catch trends earlier, but it also means more false signals if the market is choppy. In the EMA in stock market context, investors use longer EMAs (like the 50 or 200) to frame the primary trend; intraday traders prefer fast settings (8, 9, 12, 21) to read short bursts of momentum.
EMA formula explained
Alpha (smoothing factor):
α = 2 / (N + 1)
Recursive EMA:
EMA_today = α × Price_today + (1 − α) × EMA_yesterday
Equivalent form:
EMA_today = EMA_yesterday + α × (Price_today − EMA_yesterday)
Seeding note: start the EMA with an SMA of the first N periods (or the first close).
Example: N = 10 → α = 2 / 11 ≈ 0.1818. If yesterday’s EMA was 1.1150 and today’s close is 1.1200, then:
EMA_today ≈ 1.1150 + 0.1818 × (1.1200 − 1.1150) ≈ 1.1159.
This is the EMA formula most platforms use under the hood.
EMA vs. SMA
The SMA gives equal weight to all N closes; it turns slowly and can lag a new move. The EMA boosts the most recent data, so it bends sooner toward fresh direction. That “extra sensitivity” is valuable for EMA trading—earlier hints on breakouts, quicker exits when momentum fades—yet it can also mean more whipsaws. A practical rule: in strong trends, EMAs excel; in sideways ranges, they need confirmation from price action or volume.
Practical ways to use the EMA indicator
Trend filter and bias
Put a 50-EMA and 200-EMA on the chart. When price sits above both and the 50 is above the 200, the primary bias is up; below both with 50 under 200, it’s down. Position traders use these long EMAs to stay on the right side of the bigger wave.
The EMA “zone” buy/sell signals indicator
Many traders map two fast EMAs—commonly 8/21 or 9/21—and treat the space between them as a zone. In an uptrend, pullbacks that tag this zone and print a bullish candle often act as buy opportunities; in a downtrend, rallies into the zone invite sell setups. The zone functions like dynamic support/resistance, adjusting as volatility shifts.
Crossover entries
Classic EMA trading uses crossovers: a faster EMA crossing above a slower one (e.g., 9 over 21, 20 over 50) hints at a momentum shift. Crossovers work best with a higher-time-frame trend filter; for example, only take 9/21 bullish crosses when price is already above the rising 200-EMA.
Pullback and stop placement
In trend days, price often respects the 20-EMA on intraday charts and the 50-EMA on dailies. Traders buy pullbacks to a rising EMA with a stop a little below the line (plus an ATR buffer) or trail a stop under the EMA to ride the trend.
Multi-time-frame confluence
If the 21-EMA supports price on the 4-hour and the 8/21 zone holds on the 15-minute, the lower-time-frame signal has higher odds. Aligning EMAs across time frames filters noise.
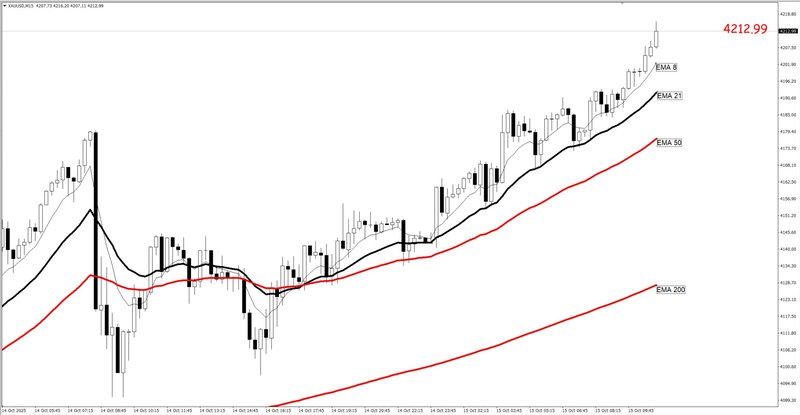
EMA settings for every style
There is no magic number, but these anchors are popular:
- 8/9 EMA: very fast momentum; scalping and intraday trend days.
- 20/21 EMA: swing rhythm; widely used for pullbacks.
- 50 EMA: intermediate trend; many stock and index traders watch it.
- 200 EMA: long-term trend; institutions often note reclaim/loss of this line.
If your market is volatile (crypto, small-caps), lengthen EMAs to reduce noise. If it’s slow (major FX pairs during Asia hours), shorter EMAs can help you see subtle turns.
Strengths and limitations
The EMA reacts quickly, highlights momentum, and provides a clean reference for dynamic support and resistance. But it is not a crystal ball. In ranges, EMAs flip back and forth, creating whipsaws. During sudden news shocks, price can slice through any moving average before you react. Treat the EMA as a map, not the destination—pair it with price structure, volume, or a volatility measure (ATR) to avoid over-trading flickers.
Risk rules when using EMAs
Before using any ema indicator signal, do the math. Decide your risk per idea (many pros stick to 0.5–1% of equity), measure your stop distance from the EMA or last swing, and size the position so a stop-out lands within that budget. If you trail behind a rising EMA, give it room with an ATR buffer; trend pullbacks are noisy, but the risk budget should be quiet and predictable.
A simple EMA plan
Start with a slow 200-EMA to define the big picture. Add a 50-EMA for the intermediate trend. For entries, use an 8/21 EMA zone: in an uptrend above the 200, wait for price to dip into the zone and print a bullish candle (engulfing, pin bar, or strong close). Enter on the next bar, stop below the zone plus ATR(14) × 0.5, and take partial profits at 1R while trailing the rest under the 21-EMA. Reverse the logic for downtrends. This framework keeps you trading with the trend and using the EMA as a living support/resistance guide rather than a standalone signal.
FAQs
What is EMA in trading?
A weighted moving average that gives more importance to recent prices, making it faster than an SMA.
Which EMA is best?
There’s no universal “best.” Use faster EMAs (8–21) for timing and slower EMAs (50–200) for trend context, then test on your market and timeframe.
Do EMAs work on all markets?
Yes—stocks, forex, futures, and crypto—because they transform price data, which all charts share.
How do I avoid EMA whipsaws?
Trade with the higher-time-frame trend, demand price action confirmation at the EMA zone, and reduce size or skip signals inside obvious ranges.


