What is butterfly pattern trading
Butterfly pattern is one of the most powerful and precise "harmonic" formations. Discovered by Bryce Gilmore and later refined by Scott Carney, this five-point reversal structure helps traders pinpoint the exact moment a trend has reached exhaustion.

XA Leg: The initial impulse move that sets the range.
Bullish butterfly typically emerges at the end of a prolonged downtrend, forming a shape that resembles the letter "M."
Since the pattern is invalidated if the price keeps running, place your Stop-Loss just beyond the 1.618 extension of the XA leg.
The anatomy of a butterfly (XABCD)
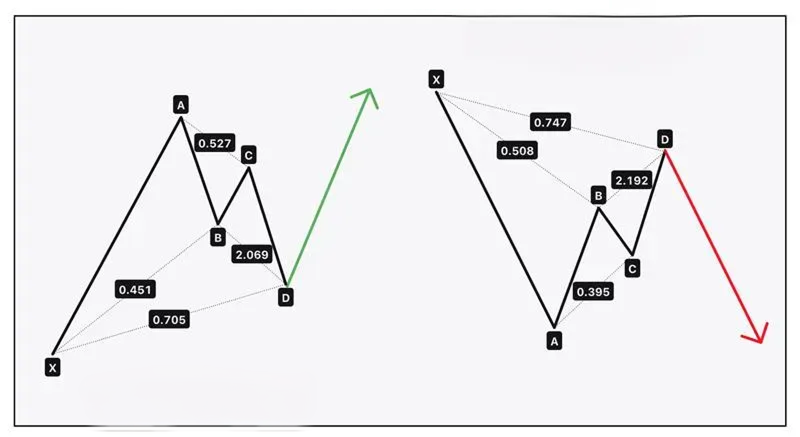
The pattern is composed of four price swings (legs) and five pivot points labeled X, A, B, C, and D. It can appear in two forms: Bullish (looks like an "M") and Bearish (looks like a "W").
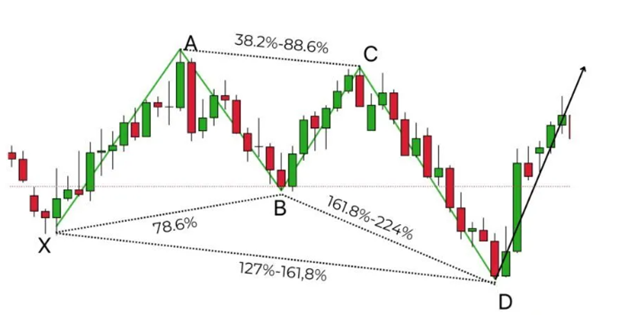
XA Leg: The initial impulse move that sets the range. AB Leg: A sharp retracement of the XA leg. Crucial Rule: Point B must be exactly at the 78.6% retracement of XA. BC Leg: A move in the same direction as the original trend. It should retrace between 38.2% and 88.6% of AB. CD Leg: The final move and the "secret sauce" of the Butterfly. Unlike other patterns, the CD leg must exceed Point X, typically reaching 127.2% to 161.8% extension of the XA leg.
While patterns like the "Gartley" or "Bat" finish inside the XA range, the Butterfly is an extension pattern. It signals that the market has overshot its target and is now primed for a massive snap-back reversal.
Bullish and bearish butterfly
Bullish butterfly typically emerges at the end of a prolonged downtrend, forming a shape that resembles the letter "M." This pattern signals that the aggressive selling pressure seen in the initial XA leg has finally exhausted itself. Even though the final CD leg makes a "scary" new low by dropping below point X, it is often a trap for late sellers. From an economist's or technician's perspective, this over-extension into the $127.2\%$ to $161.8\%$ Fibonacci zone represents a price that has become fundamentally disconnected from value, setting the stage for a powerful upward reversal. Traders watch this pattern to be completed so they can enter "long" positions just as the market begins to snap back toward the midpoint.
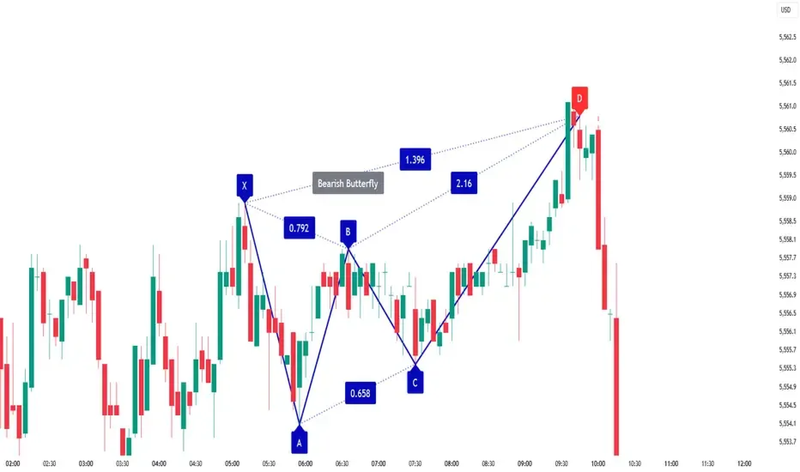
Bearish butterfly
Bearish butterfly materializes at the peak of an uptrend and takes on the visual form of a "W." In this scenario, the initial rally is met with a sharp correction at point B, but the buyers make one final, frantic push that carries the price well above the previous high at point X. This final surge often lures in retail traders who fear they are missing out on a breakout, but for the harmonic trader, it signals a state of extreme over-buying. Once the price hits that critical Fibonacci extension beyond the initial peak, the "Butterfly" is complete, suggesting that the trend is about to collapse under its own weight. This serves as a high-precision signal for traders to exit long positions or initiate "short" trades to capitalize on the impending downward correction.
Entry, stop loss, and take-profit
Trading the Butterfly requires patience. You do not trade while the wings are forming; you trade only when the "Potential Reversal Zone" (PRZ) at Point D is hit.
The entry
Wait for the price to hit the 1.272 Fibonacci extension of the XA leg. For higher accuracy, look for a "Reversal Candlestick" (like a Pin Bar or Engulfing pattern) exactly at Point D.
Stop-Loss
Since the pattern is invalidated if the price keeps running, place your Stop-Loss just beyond the 1.618 extension of the XA leg. This gives the trade room to breathe while protecting your capital if the trend continues.
Take-Profit
Target 1: Point B (The midpoint of the pattern).
Target 2: Point A (The peak/trough of the first wing).
Target 3: An extension beyond Point A if the reversal turns into a new major trend.
FQAs
What is the main difference between a Butterfly and a Gartley?
The Butterfly is an extension pattern. Unlike the Gartley, which stays within the initial price range, the Butterfly’s final point (D) must break beyond the starting point (X).
How do I confirm the pattern is valid?
Validation depends heavily on Point B. In a true Butterfly, Point B must hit a precise 78.6% retracement of the first move (XA). If the retracement is shallower (like 61.8%), the pattern is likely a different harmonic, such as a "Crab" or a "Bat."
Where should I place my stop-loss?
Standard practice is to place the stop-loss just beyond the 1.618 Fibonacci extension of the XA leg. If the price moves past this point, the harmonic structure is considered "broken," suggesting the trend is too strong to reverse.
Which timeframe is best for this pattern?
The Butterfly is "fractal," meaning it appears on all timeframes. However, it is most reliable on 4-hour and Daily charts. Smaller timeframes (like the 5-minute) are often prone to "market noise" that can distort the precise Fibonacci ratios required.
What are the typical profit targets?
Traders usually use a two-target approach. Target 1 is set at the 61.8% retracement of the CD leg (often aligning with Point B). Target 2 is set at the 127.2% extension of the CD leg, or simply at the level of Point A.


