What is Elliott wave theory
Elliott wave theory describes how investor psychology creates recurring price patterns, with smaller waves combining to form larger market structures over time.

Elliott wave theory offers an objective framework to assess probable future market paths based on recurring behavioural price structures.
Elliott’s core framework is built around impulsive waves that move with the dominant trend and form the backbone of market price progression.
Market progress typically unfolds through a structured sequence of five waves that reflect expansion in the prevailing trend direction.
A full Elliott wave cycle consists of eight waves split into two phases combining trend movement and corrective behaviour.
Pattern analysis
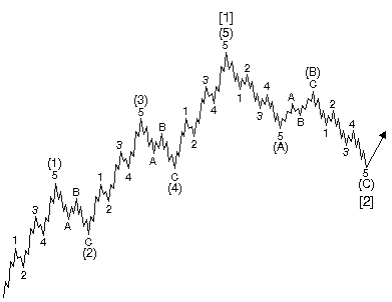
Elliott Wave patterns are made up of impulsive waves (numbers) and corrective waves (letters). An impulsive wave has five smaller waves and moves with the main trend, while a corrective wave has three smaller waves and moves against the trend. These waves combined to form larger patterns, which Elliott calls degrees. For example, in a bigger trend, wave 1 moves up with five smaller waves, showing the larger trend is also up. Then comes wave 2, a smaller three-wave correction down. Waves 3, 4, and 5 finish the larger upward move. After that, a bigger three-wave correction happens, and the pattern continues in the same way at higher levels. The key point is that in a larger time frame, waves 1, 3, and 5 go with the main trend. If you zoom in on a smaller time frame, each of these waves also has five smaller waves moving in the same direction. Meanwhile, waves 2 and 4, when viewed on a lower time frame, show three smaller waves going against the main trend. This pattern repeats at every level, with small waves building a bigger trend and corrections giving pullbacks. that move against the main trend. This fractal structure repeats across all time frames, with smaller waves building up the larger trend while the corrective waves provide pullbacks. Waves 3, 4, and 5 finish a bigger upward move called wave (1). Just like wave 1, this larger wave shows that the next bigger trend is also up and is followed by a three-wave pullback, called wave (2). After that, waves 3, 4, and 5 happen again to complete an even bigger upward move, called wave [1], followed by another three-wave correction, wave [2]. The important thing is that at each wave 1 peak, the pattern works the same way no matter the size. Waves come at different levels or degrees, with smaller waves building bigger ones. waves A and C may be smaller-degree impulsive waves, consisting of five sub waves. This is because they move in the same direction as the next larger trend, i.e., waves (2) and (4) in the illustration. Wave B, however, is always a corrective wave, consisting of three sub waves, because it moves against the larger downtrend. Within impulsive waves, one of the odd-numbered waves (usually wave three) is typically longer than the other two.
Applying the wave principle
The main goal of any market analysis is to find good buying points (and selling points. The Elliott Wave Principle is very useful for this. However, it does not guarantee what the market will do. Instead, it helps estimate the most likely paths the market might take. At any time, there are usually two or more valid ways to interpret the waves. The rules of the Wave Principle are clear and specific, which keeps the number of valid interpretations small. Among these, the analyst usually chooses the one that fits the most rules as the main or preferred scenario. The other valid interpretations are ranked as alternate scenarios. Alternate scenarios are important they are not wrong. They are just less likely than the preferred count. They act as a backup plan in case the market does not follow the main scenario. Using both the preferred and alternate counts helps investors plan for different possible market moves. A long-term stock market forecast can give clues about changes in social mood and how people behave. The Elliott Wave Principle reflects these changes in mood, so it’s not surprising that trends in popular culture like entertainment, fashion, or politics often move in line with the stock market. What people like, how they express themselves, and what political ideas are popular all reflect social moods, and these moods often match the patterns seen in the market. When moods reach extreme highs or lows, changes in cultural trends can usually be predicted.
The five wave pattern
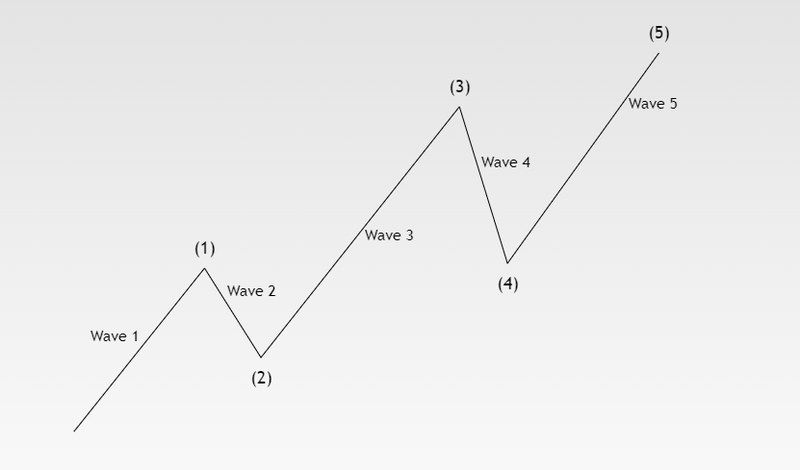
In the markets, price movement usually happens in five waves. Three of these waves 1, 3, and 5 move in the main direction of the trend. Between them there are two waves, 2 and 4 which move against the trend. These counter-trend waves are necessary for the overall movement to happen. There are two types of waves: motive and corrective. Motive waves have a five-wave structure and push the market in the main direction. This includes waves 1, 3, and 5. Corrective waves have a three-wave structure and move against the trend, like waves 2 and 4. Corrective waves only partially reverse the progress made by the preceding motive wave. These two types of waves work differently and have different roles in building market trends. Patterns of five waves up and three waves down form a complete cycle of eight waves. The pattern of five waves up followed by three waves down is depicted.
Source: Trading View
The complete cycle
Major Impulse Wave (labeled 1): This entire upward movement shows a bullish (upward) trend. It is subdivided into 5 smaller waves: (1), (2), (3), (4), and (5). Notice how the (3) wave is an impulse move, consisting of 5 even smaller waves (1, 2, 3, 4, 5) and the (4) wave is a correction (A, B, C). This is the fractal nature of the theory waves within waves. Then major Corrective Wave (labeled 2): This downward movement shows a bearish (downward) correction of the trend established by wave [1]. It is subdivided into 3 smaller waves: (A), (B), and (C). Wave (A) is an impulse down (5 sub-waves). Wave (B) is a correction up (3 sub-waves: A, B, C). Wave (C) is an impulse down (5 sub-waves: 1, 2, 3, 4, 5). The arrow at the end suggests the completion of the major correction [Wave 2], and using this theory would expect a new, major Impulse Wave [Wave 3] to begin next, driving the price higher and do the 5 wave same as Wave 1. The market is built in a way that big waves are made up of smaller waves, and those smaller waves are also made up of even smaller waves. For example, two waves of one size break down into eight waves of the next smaller size, and those eight waves break down into thirty-four even smaller waves. This means that waves exist at different levels: every wave is part of a bigger wave and made up of smaller waves. Using the same chart, we can show two waves, eight waves, or thirty-four waves, depending on which level (Timeframe) we are looking at.
FAQs
Does Elliott Wave Theory really work in financial markets?
It works as a subjective analytical framework, not a guaranteed prediction system. It provides a high-level structure for anticipating market cycles based on recurring investor psychology.
What are the most common mistakes when applying Elliott Wave Theory?
Improper Wave Counting: Incorrectly labeling the start, end, or degree of the mandatory 5-3 pattern. Violating Core Rules: Failing to recognize when strict rules (like the non-overlap rule for Wave 4) are broken, which signals the current count is invalid.
Can Elliott Wave Theory be combined with other technical indicators?
Yes, and combining it is essential for reliability. Due to its subjectivity, EWT should be confirmed by objective technical tools to increase the probability of a successful trade.


