Chart Patterns
Traders use chart patterns with other technical indicators and analysis methods to make informed decisions about buying, selling, or holding financial assets.

Chart patterns are integral tools for traders and investors seeking to navigate the complexities of financial markets
Patterns like breakout or reversal patterns, when combined with volume analysis, can offer valuable signals about the strength or weakness of a price movement, aiding traders in making more informed decisions
By recognising recurring patterns in price movements and grasping the nuances of price behaviour at key support and resistance levels, traders can enhance their ability to time their trades effectively and manage risk
Introduction to chart patterns
Understanding chart patterns and price action is paramount for traders and investors alike. These tools provide valuable insights into market sentiment, allowing individuals to make informed decisions about buying, selling, or holding financial assets.
By recognising recurring patterns in price movements and grasping the nuances of price behaviour at key support and resistance levels, traders can enhance their ability to time their trades effectively and manage risk.
Furthermore, mastering chart patterns and price action empowers investors to decipher the underlying psychology of market participants, enabling them to stay ahead in the dynamic and competitive world of financial markets.
To properly understand chart patterns, which are visual representations of price movements in financial markets (such as stocks, commodities, or currencies), we have to understand what price action is and how it forms.
Price action analysis
Price action analysis, a subset of technical analysis, focuses solely on the study of price movements, omitting the reliance on traditional indicators or oscillators. It places significant emphasis on recognising how price behaves across various levels, particularly at crucial support and resistance points, and acknowledges the substantial influence of market psychology on price dynamics.
In essence, understanding price action serves as the cornerstone for effectively interpreting and leveraging chart patterns. There are two types of patterns and formations in technical analysis, candlestick, and chart patterns.
Candlestick patterns: These are specific formations of candlestick charts that provide insights into market sentiment and potential trend reversals. Examples include the Doji, Hammer, and Shooting Star patterns. Understanding these patterns is integral to comprehending price action and chart patterns, as they offer valuable clues about market psychology and potential shifts in the prevailing trend.
Chart patterns: Price action traders often rely on chart patterns, such as Head and Shoulders or Bullish Engulfing, to make trading decisions based on the price's natural ebb and flow. These patterns, when analysed in conjunction with price action, enhance the trader's ability to anticipate market movements, identify entry and exit points, and effectively navigate the complexities of financial markets.
Different categories of chart patterns
There are different types of chart patterns, and they can be categorised by what kind of information and predictions they provide about particular price movements.
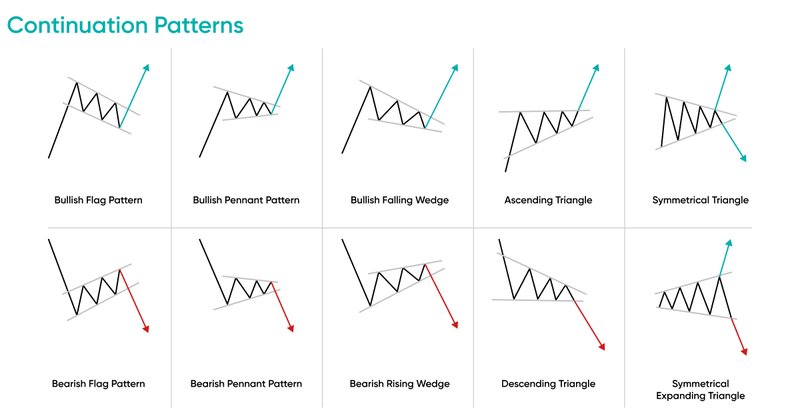
Continuation Patterns: These patterns imply that the current trend is likely to persist. Examples of these kind of patterns include flags, pennants, and triangles.
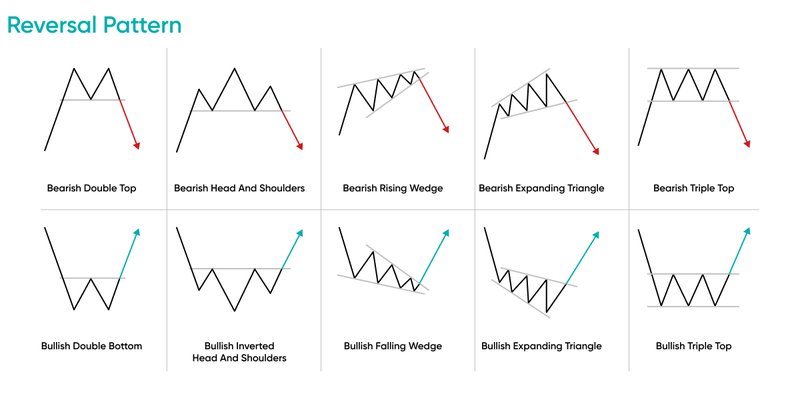
Reversal Patterns: These patterns suggest a change in the prevailing trend. Examples include the head and shoulders, double top, and triple bottom patterns.
Consolidation Patterns: These patterns indicate a period of market indecision or consolidation, such as the rectangle or range-bound patterns.
Complex Patterns: Some patterns, like the cup and handle or the rounding bottom, combine elements of both reversal and continuation patterns.
It's important to note that while these patterns can provide valuable insights, they are not foolproof and should be used in conjunction with other forms of analysis and risk management strategies.
Most common chart patterns
Let’s have a look at some of the most common chart patterns in more detail.
- Head and Shoulders pattern
The Head and Shoulders pattern consists of three peaks: a higher peak (head) between two lower peaks (shoulders). This pattern signals a reversal from an uptrend to a downtrend. When the price breaks below the neckline (a support level connecting the two shoulders), it confirms the pattern.
Formation:
Left shoulder: The pattern begins with an uptrend in the price of an asset. The left shoulder is the first peak, which is typically a high point on the chart.
Head: After the left shoulder, the price experiences a higher peak, known as the head. This peak is higher than the left shoulder and often represents a significant high point in the trend.
Right shoulder: Following the head, the price retraces, forming a lower peak compared to the head. This forms the right shoulder of the pattern.
Neckline: The neckline is a support level that connects the lows of the left shoulder and the right shoulder. It serves as a critical level to watch in the pattern.
- Double Top pattern
The Double Top pattern signals a reversal from an uptrend to a downtrend and consists of two peaks at approximately the same price level. Breakouts from the pattern's neckline confirm the trend reversal.
Formation:
Initial uptrend: The double top pattern usually forms after a prolonged uptrend in the price of an asset.
First peak (Top): The initial peak represents a high point in the uptrend. It’s often followed by a retracement in price.
Trough: Following the first peak, the price retraces, forming a trough or downwards “v” shape. This trough indicates a temporary decline.
Second peak (Top): After the trough, the price makes another attempt to rise but fails to exceed the level of the first peak, forming a second peak.
- Double Bottom pattern
The Double Bottom pattern signals a reversal from a downtrend to an uptrend and consists of two troughs (or valleys) at approximately the same price level. Breakouts from the pattern's neckline confirm the trend reversal.
Formation:
Initial downtrend: The Double Bottom pattern usually forms after a prolonged downtrend in the price of an asset.
First trough (Bottom): The initial trough represents a low point in the downtrend. It’s followed by a temporary upward price movement.
Peak: Following the first trough, the price retraces and forms a peak, indicating a temporary rally.
Second trough (Bottom): After the peak, the price declines again but fails to fall below the level of the first trough, forming a second trough.
- Triple Top and Triple Bottom patterns
Triple Top and Triple Bottom patterns are like Double Top and Double Bottom patterns, but with three peaks (Triple Top) or three troughs (Triple Bottom). These patterns indicate stronger potential reversals than their double counterparts.
- Flag and Pennant patterns
Flag and Pennant patterns typically appear after a strong price movement and represent a brief consolidation before the previous trend continues.
Flags are rectangular-shaped and slope against the prevailing trend, whereas pennants are small symmetrical triangles.
Breakouts from these patterns can signal the continuation of the existing trend.
Flag pattern
Formation:
Strong price movement: The Flag pattern forms after a strong price movement in one direction, whether it's an uptrend (bull flag) or downtrend (bear flag).
Rectangular consolidation: After the initial price movement, the Flag pattern takes shape as a rectangular consolidation phase. This consolidation phase forms a flagpole, characterised by nearly parallel trendlines.
Pennant pattern
Formation:
Strong price movement: Like the Flag pattern, the Pennant pattern forms after a significant price movement, whether it's an uptrend (bull pennant) or downtrend (bear pennant).
Symmetrical triangle consolidation: The consolidation phase of a Pennant pattern takes the form of a symmetrical triangle, with converging trendlines.
- Symmetrical Triangle pattern
Symmetrical Triangle pattern forms when the price moves within converging trendlines, creating a triangle shape. It suggests a period of consolidation before a significant price breakout in either direction.
The breakout direction is not predetermined and can be either bullish or bearish.
Formation:
Converging trendlines: The Symmetrical Triangle pattern consists of two trendlines that converge towards each other. One trendline connects the series of lower highs (resistance), while the other trendline connects the series of higher lows (support).
Symmetrical shape: The pattern's shape is symmetrical, meaning that the angle of ascent on the support trendline is roughly equal to the angle of descent on the resistance trendline. This creates a triangular pattern.
- Ascending Triangle and Descending Triangle patterns
Ascending Triangles have a flat upper trendline and a rising lower trendline, suggesting potential bullish breakouts.
Descending Triangles have a flat lower trendline and a declining upper trendline, suggesting potential bearish breakouts.
- Cup and Handle pattern
Cup and Handle pattern resembles a teacup and a handle and is considered a bullish continuation pattern. The cup forms a rounded bottom, followed by a smaller consolidation (the handle). A breakout from the handle signals a potential upward move.
- Rounding Bottom (Saucer) and Rounding Top patterns
A Rounding Bottom pattern signals a potential bullish reversal, while a Rounding Top indicates a bearish reversal. These patterns depict a gradual change in sentiment as prices round off, forming a curved shape.
- Rising Wedge pattern
Rising Wedges have a diagonal support line and a steeper resistance line, signalling a potential bearish reversal.
Formation:
Converging trendlines: The Rising Wedge pattern consists of two trendlines that converge towards each other. The upper trendline slopes downward, while the lower trendline slopes upward.
Bearish Sign: This pattern typically forms during a downtrend and often signifies a bearish continuation. It represents a period of consolidation where the price makes lower highs and higher lows.
- Falling Wedge pattern
Falling Wedges have a diagonal resistance line and a steeper support line, signalling a potential bullish reversal.
Formation:
Converging trendlines: The Falling Wedge pattern also consists of two trendlines that converge towards each other. The upper trendline slopes downward, while the lower trendline slopes upward.
Bullish sign: This pattern typically forms during a downtrend and often signifies a bullish reversal. It represents a period of consolidation where the price makes higher lows and lower highs.


