Leading vs. lagging indicators
Learn what leading and lagging technical indicators are and how they can help you make smarter trading decisions.
Technical indicators are mathematical calculations that help traders to forecast future price movements and verify current trends
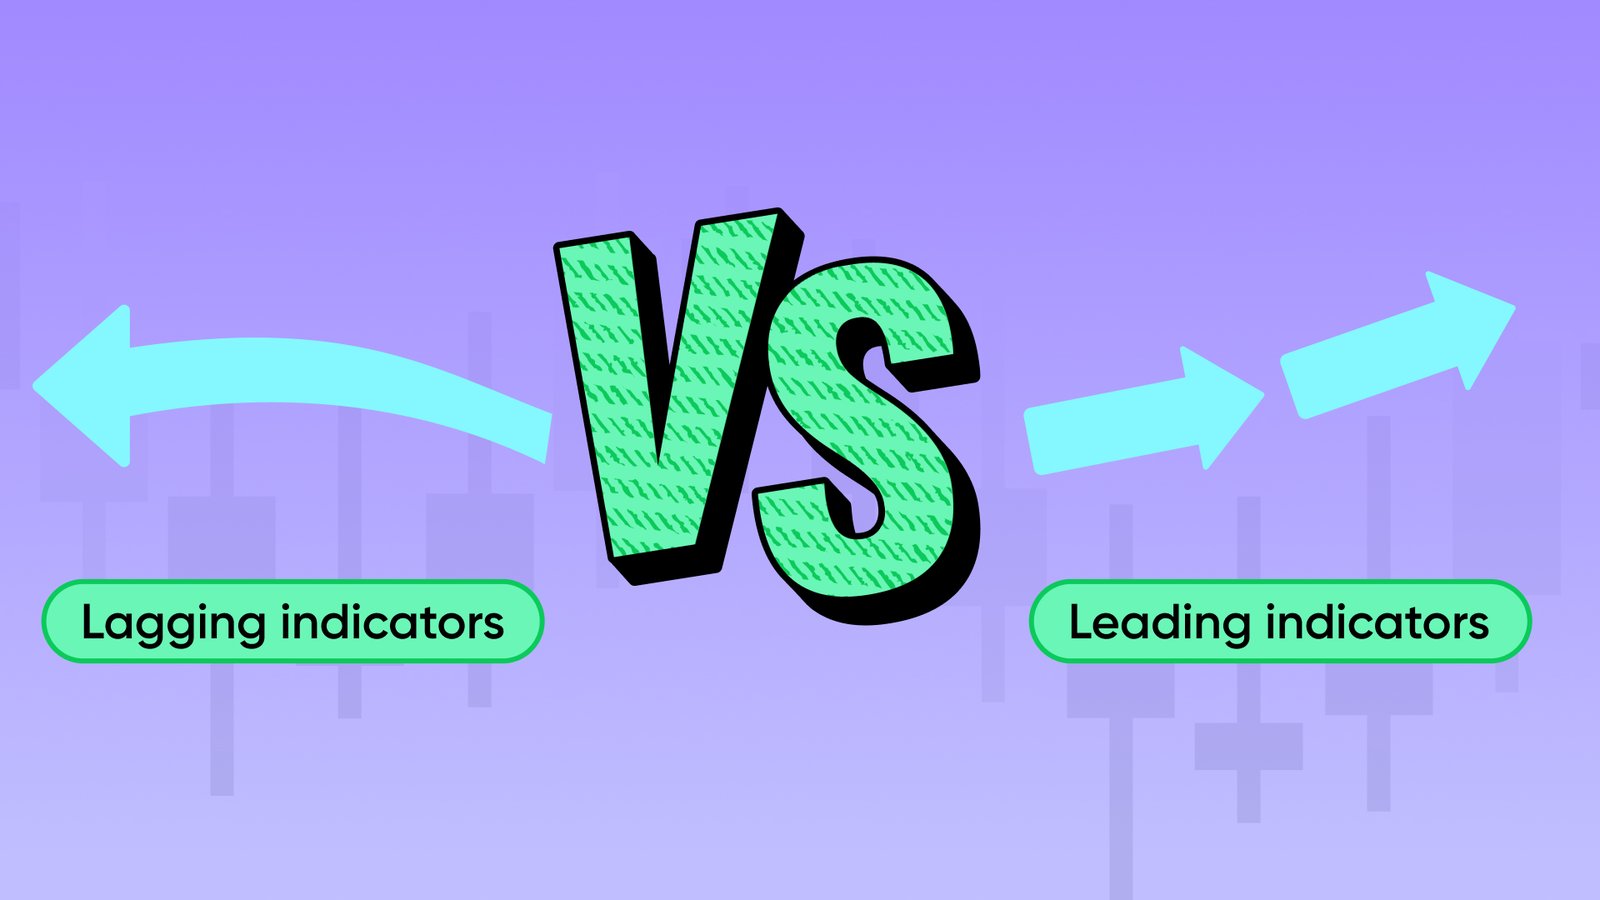
Leading indicators predict market movements and provide potential entry and exit points, while lagging indicators confirm trends, ideal for traders who prefer a wait-and-see approach
Relative Strength Indicator (RSI), On-balance volume (OBV), and the Stochastic oscillator are commonly used leading indicators
Moving averages, MACD Indicator and Bollinger bands are popular lagging indicators
What's the difference between leading and lagging indicators?
Technical indicators are mathematical calculations that are based on the price, volume, or open interest of an asset and displayed as patterns on charts. Technical analysis indicators can be categorised in many ways.
Leading and lagging indicators are the yin and yang of technical analysis, each offering unique insights into market behaviour and the potential future price movements of financial instruments.
The primary distinction between them lies in their time-phase; focus-leading indicators attempt to forecast future market movements, while lagging indicators are designed to confirm past trends.
In essence, leading indicators are proactive as they offer traders the chance to get ahead of the curve, but this includes a risk of potential false positives. On the other hand, lagging indicators are reactive which ensures traders are following confirmed trends, but sometimes at the cost of missing the initial wave or price surge.
Each type of indicator can be a useful tool, and the most successful trading strategies often integrate many indicators to balance the risk of both predictive and past data.
Leading indicators: Features and examples
Forward-looking signals
Leading indicators are sometimes described as the market’s crystal ball, signalling traders on the likelihood of future price movements before they occur. They are particularly useful in anticipating shifts in the market, providing entry and exit points that maximise potential changes in trend direction.
Speed and sensitivity
Leading indicators typically react quickly to price fluctuations, making them sensitive to immediate market movements. However, this sensitivity can be a double-edged sword, as it can lead to false signals or premature entries or exits.
Examples and uses
Common leading indicators include the Relative Strength Index (RSI), which measures the speed and change of price movements on a scale of 0 to 100, and the Stochastic Oscillator, which compares a closing price to its price range over a given time period. An RSI reading above 70 is typically considered overbought, while an RSI below 30 is considered oversold. Traders often employ these tools in ranging markets where they can capitalise on the perceived cyclical nature of price movements.
Scenario of using a leading indicator
The Nasdaq 100, made up mostly of technology companies, has been observed to often follow cyclical patterns, making it a good candidate for RSI analysis. RSI often indicates when assets are overbought or underbought, which can signal to traders that the price will potentially reverse to remain within its support and resistance levels.
Imagine the Nasdaq 100 has been trading in a range between 11,000 and 11,500 points over several weeks, without breaking out in either direction.
Timeframe: The RSI is typically set to a 14-day period for this example.
Observation: As the index approaches the 11,500 resistance level, the RSI climbs towards 70 indicating an overbought condition, but ends the trading day at 11,480 with an RSI reading of 68.
Interpretation: The RSI value of 68 (nearing 70) suggests that the index is heading towards overbought conditions, and this may signal the price is about to reverse or pullback in price as demand levels start to recede - allowing the asset to continue trading within a range of 11,000 and 11,500.
Action: A trader might interpret this as a signal to prepare to sell or take a short position, by anticipating that the index’s price will revert after nearing its support level of 11,500.
Lagging indicators: Features and examples
Historical confirmation
Lagging indicators are like history books for the stock market, showing trends only after they've already started. These tools are valuable for traders who prefer to wait for confirmation that a trend is in place before making a trade, as they hope to reduce the likelihood of acting on false signals.
Stability and reliability
Because they follow market events, lagging indicators are generally considered more stable and reliable than their leading counterparts. They may not provide the earliest signals, but the ones they do offer are often backed by established market direction.
Examples and uses
Examples of lagging indicators include the Moving Average Convergence Divergence (MACD and Bollinger Bands. MACD is a momentum indicator composed of three parts (the MACD line, signal line and histogram) that tracks the relationship between an asset’s two moving price averages, when the price nears closer or further from the indicator lines it can identify the best time to buy or sell. Bollinger Bands help detect overbought or oversold conditions by placing two lines a set distance away from a security's price moving average. Narrow bands suggest low volatility and wide bands indicate a highly volatile market. These indicators are frequently used to assess market conditions, price volatility, and the strength of a trend’s direction or speed.
Scenario of using a lagging indicator
Let’s use the Nasdaq 100 again, but this time with the MACD indicator. Imagine it has been trending upwards over the past few months, moving from 12,000 to 13,000 points.
Timeframe: MACD is built on three different numbers - a 3-day, 12-day and 26-day exponential moving average. Please note that an exponential moving average will prioritise the use of newer data more than older data.
Observation: As the Nasdaq 100 reaches 13,000, the MACD line is now at 35 which has crossed below the signal line of 40 - which could indicate the trend is reversing or slowing down.
Interpretation: The crossover of the MACD line below the signal line, especially after a significant uptrend, could indicate that the current trend is weakening and may soon reverse or enter a consolidation phase.
Action: Traders might see the MACD crossing over as a hint to sell their profitable trades or get ready to go long with the expectation that prices will start falling, especially if other signs point to a bearish or downward trend.
