Support and Resistance 101
Used in technical analysis, support and resistance levels are typically used to help traders decide the best possible price point to open or close a trade.
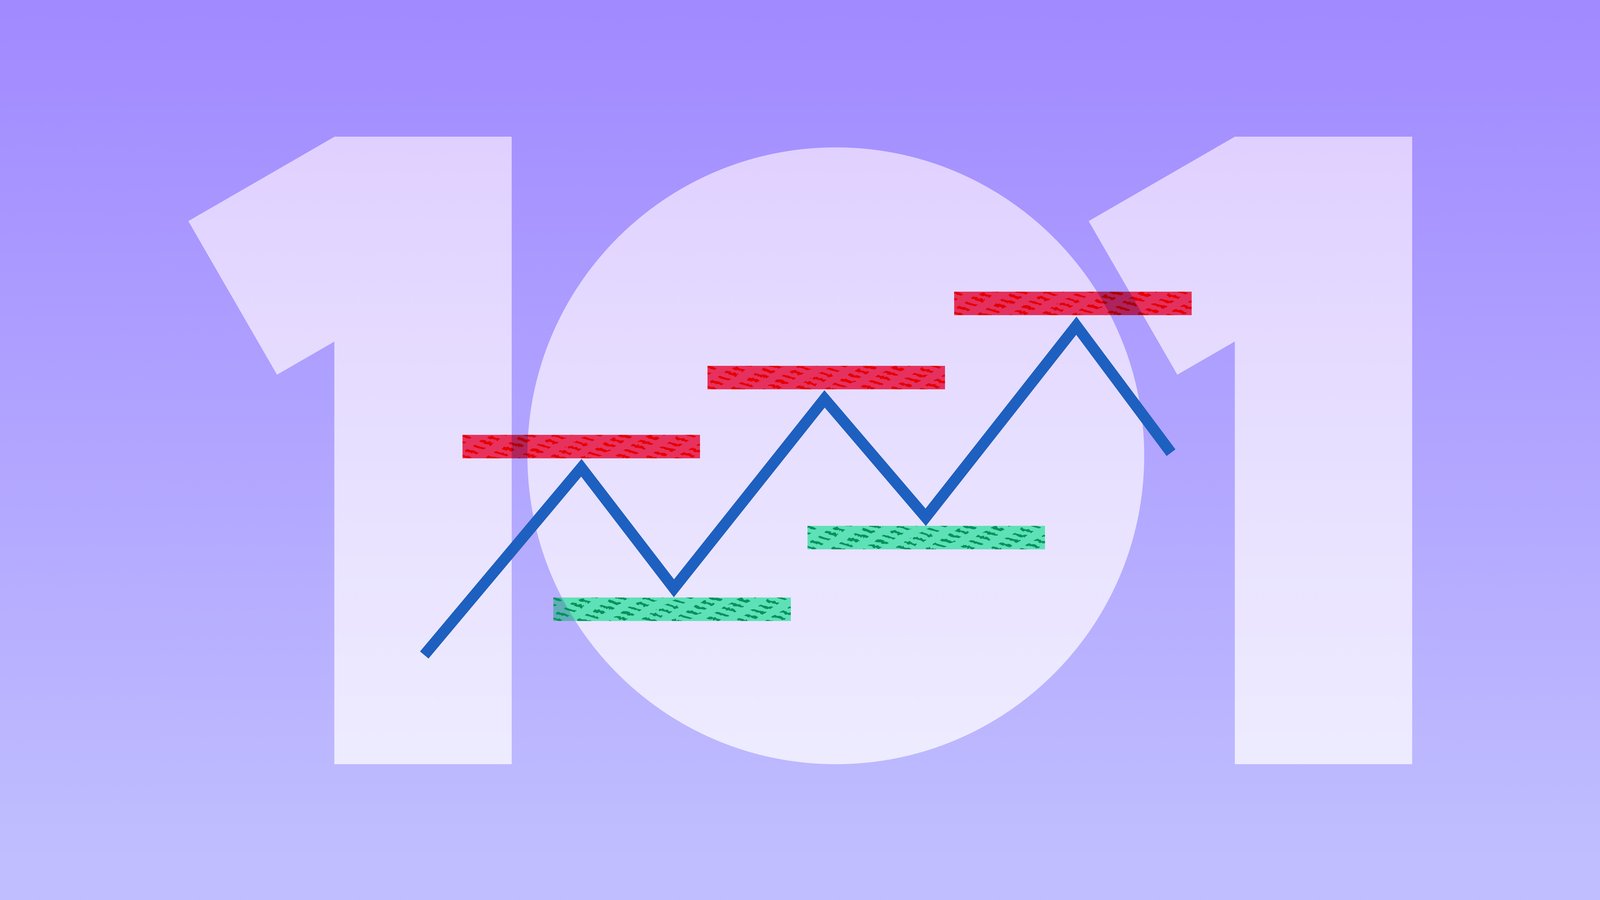
Support and resistance levels are horizontal price lines seen on a market chart that help traders identify and frame trends with the aim to place profitable trades efficiently
Support levels, based on previous price data, act as a “floor” to indicate the lowest point an asset’s price might reach before rebounding, and resistance levels show the highest point a price might reach before falling again within a trend range
These levels can function as indicators of potential market reversals or trends in online trading and are an essential technical analysis tool for many trading strategies
What are support and resistance levels?
Whether you are an experienced trader or a beginner, it’s important to understand the basics of technical analysis and the underlying principles that constitute it to make informed decisions in the financial world.
Technical analysis refers to reading previous price data and charts to identify trends and patterns that can be used to predict future price movements and make smarter trading decisions. Support and resistance are two crucial technical concepts that hold significant importance in interpreting price charts.
Past analysis shows that many trends, or repeating price patterns, will occur within a set range where the highest price point is called the resistance level and the lowest is called the support level.
In other words, support levels indicate the lowest price an asset might reach within a trend before rebounding or gaining value again. This is often referred to as “a floor” beneath the asset’s price as traders expect that when an asset approaches its support level, there’s a higher chance it will temporarily stop declining or start to bounce back.
On the contrary, resistance levels show the highest level that a price might reach until it meets resistance and is pushed down again. This is the level at which the asset will encounter selling interest, which acts as “a ceiling” that stops the price from rising further. Price past data and moving averages can also show that assets are more likely to face difficultly breaking through this level.
Support and resistance are considered important because they represent when market participants have historically made buying and selling decisions. They can be used to predict the price movements of all trading markets, including shares, forex, and indices.
Predicting price movements with support and resistance levels can be used by traders as part of their trading strategies to pinpoint entry and exit points for positions and enhance risk management. These levels can also help traders to identify breakouts and trading ranges and to confirm trends.
How supply and demand affects support and resistance
The concepts of support and resistance are based on the fundamental principle that market prices are affected by the interplay of supply and demand.
When demand surpasses supply, prices tend to rise, while when supply exceeds demand, prices fall. In certain situations, prices may remain stagnant when supply and demand are balanced.
During a downtrend, prices might decline due to an excess supply of shares in the market. However, as prices persistently decrease, more investors express interest in purchasing said shares at a lower cost. Eventually, the demand for these shares would increase to a level that matches its supply, leading to a point where the price decline would cease. This is commonly referred to as support.
Support can be represented by a specific price level or a broader range. It marks the region on the price chart where buyers are willing to purchase shares. When the demand surpasses supply at this point, the downtrend can stop and even reverse, providing profitable opportunities for investors.
In the area of technical analysis, resistance embodies a level on a price chart where the pressure of selling overrides demand, leading to a halt in the price growth. This level is attained as prices continue to increase, with traders gauging that shares are either excessively priced or have approached their target levels.
In this scenario, buyers may be discouraged from initiating new positions at such elevated prices. A technician can effectively pinpoint this level on a price chart, which may either be a specific point or a more comprehensive range.
Identifying support and resistance levels
To pinpoint support or resistance levels, traders analyse price charts to identify significant pauses in price declines or rises and assess whether prices will halt or reverse as they approach these levels. Nowadays, most trading platforms have built-in tools that use AI and algorithms to add support and resistance levels easily to market charts allowing traders to evaluate trends far more easily.
Support and resistance levels can be detected across all charting timeframes ranging from one-minute charts to weekly and monthly charts. The more times the price of the asset has touched its resistance or support levels on the chart, the more significant those levels become.
Support and resistance levels can be drawn on price charts using various methods including simple horizontal lines connecting price points, upward or downward trendlines and more advanced technical indicators like moving averages or Fibonacci retracements.
Horizontal lines and trendlines are drawn by connecting a series of highest or lowest prices together, whereas a simple moving average is an average of prices over a specified time and can be calculated based on closing, opening, minimum or maximum prices.
Accomplished traders also often take note of past support or resistance levels, employing this information to anticipate future reactions. For example, if the price breaks above the resistance line, that line can become the new support and vice versa.
It’s good to remember that support and resistance are not usually exact numbers but wider areas or regions on an asset’s price chart. However, there is a tendency for round numbers to act as psychological support and resistance lines in the financial markets. These means that key numbers like 25, 50, 100 or 1000 have extra importance to traders as price targets, and often affect their actions when entering and exiting positions.
How to use support and resistance levels in trading
Support and resistance levels are important tools in a trader’s toolkit, and they play a crucial role in some trading strategies including breakout and range bound trading.
However, each trader can determine how best to incorporate them into their own trading strategies to improve their chances of achieving their investment goals through successful trades.
Let’s have a look at some of the most common ways traders use support and resistance levels.
Breakout trading
Once the support or resistance levels have been established, they can serve as potential entry or exit points for trades. Breakout traders wait for a price to break through its resistance level to open long positions, or its support level to go for short positions. Sometimes prices can break support or resistance levels by closing outside but still return to the previous levels the next day, and breakout traders should stay alert for these false breakouts.
Trend trading
Trend traders can use support and resistance levels to validate the direction of a prevailing trend. Support and resistance levels can also highlight reversals in trends. Trend traders often combine other trend confirmation techniques together with support and resistance levels to make more informed decisions and increase their potential for success.
Range-bound trading
There are also moments when there is no upward or downward trend in the market. When markets don’t have a clear trend, support and resistance lines can help traders to identify potential price ranges and take profits from short-term price movements. In range-bound trading, traders buy at the support level and sell at the resistance for long positions, or buy at the resistance and sell at the support for short positions.
Price targets
As it can be difficult to predict the potential profit of a trade, analysing support and resistance levels can help traders to make informed decisions about where to exit the position for profit. For example, in an uptrend where the price has approached its resistance level, traders are likely to exit their position because meeting resistance suggests it will not continue to rise any higher.
Risk management
Support and resistance levels are especially useful when it comes to risk management. A stop loss order is one of the most popular risk management tools and many traders use support and resistance levels to set these orders as they suggest turning points for prices. For long positions, a support level can serve as an indication for where to place the stop loss level to protect against potential losses if the asset moves wildly out of range. Usually, traders place the stop loss right below the support level. For short positions, the stop loss is often placed right above the resistance level as the trader hopes to gain profits from falling prices instead.
Mastering support and resistance trading requires practice
Despite the apparent simplicity of the principles governing support and resistance, achieving mastery in their application requires expertise, practice and experience.
Even the most advanced traders will continue to refine their techniques and deepen their comprehension of how these concepts can be employed to anticipate market movements, so don’t be concerned if your trading strategy doesn’t always go to plan.
If you feel like you need a bit of practice, open a demo account to test trading with support and resistance levels and to practice using trendlines and other charting tools. Trying out your ideas with a demo account is totally risk-free as you don’t need to invest any capital.
Anyone can open a test account in minutes and access world’s most exciting financial markets on a real trading platform using virtual funds to place simulated trades.
