Amazon earnings preview: Financial and technical analysis
Amazon’s shares currently exhibit a robust long-term bullish performance, underpinned by the firm’s strengthening fundamentals. Total revenue has demonstrated consistent growth, while leverage risk management has seen significant improvement in recent years. Furthermore, net income has staged a notable recovery following its contraction in 2022.

The analyst consensus anticipates that Amazon’s total revenue will rise by 13% on a year-on-year (YoY) basis, accompanied by a 6% increase in earnings per share (EPS) over the same period.
Amazon’s financial position remains strong, characterised by a steady growth rate in both revenue and total assets, alongside a well-contained leverage risk profile.
While technical analysis signals a sustained long-term bullish trajectory, momentum indicators reflect a more neutral development, suggesting that a period of short-term uncertainty may be materialising.
Amazon: earnings expectations
Amazon Inc. is scheduled to release its Q4 2025 financial results following the market close on Thursday, 5 February 2026. The market consensus estimates total revenue at $211.44 billion and earnings per share (EPS) at $1.97. These forecasts imply a YoY increase of 12.6% in total revenue and a 5.9% rise in EPS. Although these figures represent a solid performance, they sit slightly below the historical averages observed during the broader period under analysis.
Financial analysis of Amazon Inc.
From a fundamental perspective, Figure 1 illustrates that Amazon has sustained a long-term upward trajectory in total revenue, alongside a significant recovery in net income since Q4 2022. During the period 2020–2025, the company recorded an average revenue growth rate of 17% and an average net income growth rate of 23%.
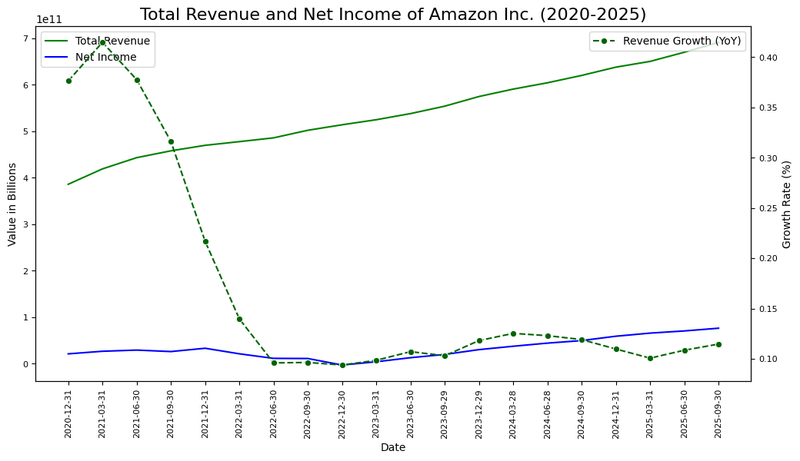
Figure 1. Total revenue, net income, and respective growth rates of Amazon Inc. (2020–2025). Source: Own analysis using data from the Nasdaq Exchange.
Additionally, as illustrated in Figure 2, Amazon’s net margin has experienced relevant fluctuations over the past few years, reaching 11% in Q3 2025. The net margin has averaged approximately 6% and has shown a substantial recovery since Q4 2022, when the indicator was reported as slightly negative.
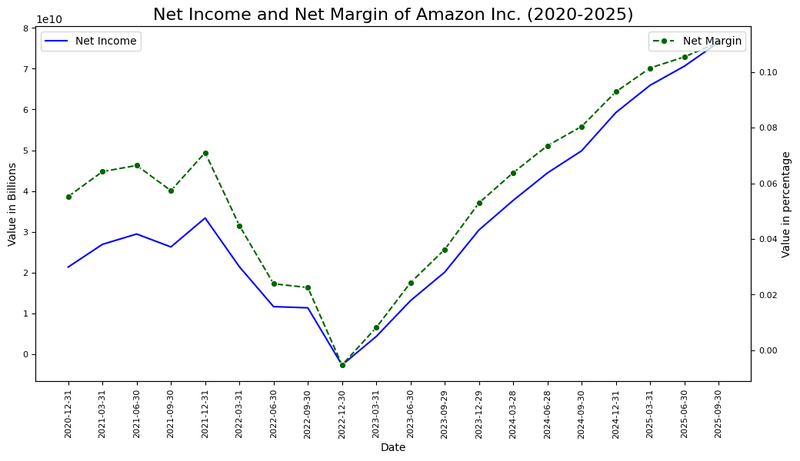
Figure 2. Net margin trend and profitability analysis of Amazon Inc. (2020–2025). Source: Own analysis using data from the Nasdaq Exchange.
Finally, Figure 3 highlights a consistent expansion of total assets since 2019, reflecting the firm’s ongoing commitment to infrastructure development and industrial scale. This expansion has been meticulously managed alongside strategic improvements in leverage; the debt ratio decreased to 24% in 2024, falling below the industry average. In summary, while Amazon exhibits significant strength in revenue, net income performance has been more moderated; meanwhile, the company has effectively improved its leverage risk management as total assets continue their upward trajectory.
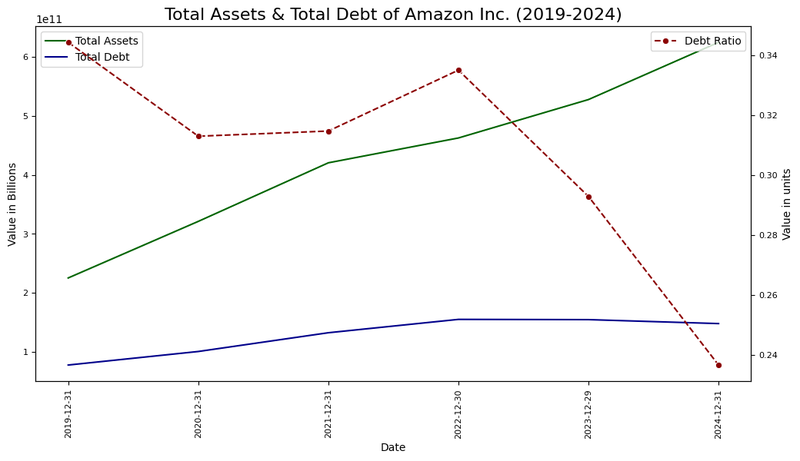
Figure 3. Total assets, total debt, and debt ratio of Amazon Inc. (2019–2025). Source: Own analysis using data from the Nasdaq Exchange.
Technical analysis of Amazon’s shares
Regarding the technical outlook, Amazon’s share price maintains its primary long-term bullish trajectory. Key observations include:
- Trend Context: Over the long term, Amazon preserves a market structure defined by a sequence of ‘higher highs’ and ‘higher lows’. The price is currently trading above its 50, 100, and 200-day simple moving averages (SMAs), reinforcing the prevailing bullish momentum.
- Resistance Levels: Should price action breach the immediate resistance at $248, the next significant technical level is $255 (the historical peak). A decisive close above this level would likely initiate a new expansionary phase toward higher valuation zones.
- Support Levels: If the immediate support at $225—representing the floor of the bullish channel pattern and the proximity of the 200-period SMA—is invalidated, the next critical floor is identified at $190 (a structural support). A failure to defend the $190 level would substantially increase the probability of a more pronounced market correction.
- Momentum and Volume: Both the Moving Average Convergence Divergence (MACD) and the Relative Strength Index (RSI) are currently trading in neutral territory, suggesting that prices are awaiting a fundamental catalyst to initiate a more decisive movement.
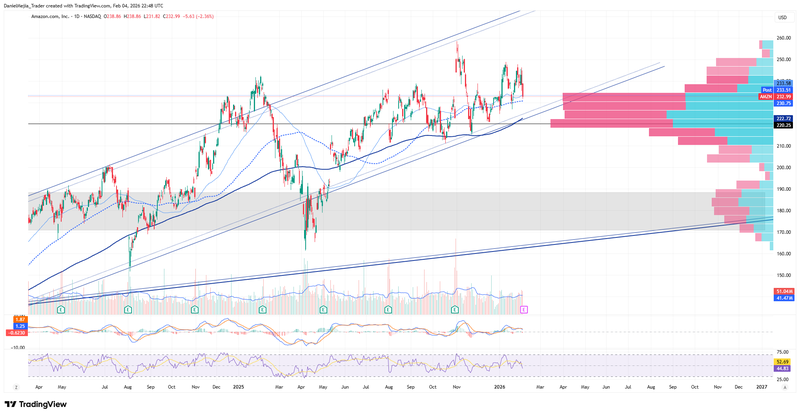
Figure 4. Amazon’s share price performance and technical indicators (2024–2026). Source: Data from the Nasdaq Exchange; Own analysis conducted via TradingView.


