
 Support
Trading Ideas
Get the edge with potential investments and opportunities
Infrastructure investing: key factors and market drivers
Infrastructure investment drives essential services, being commonly characterised by inelastic demand, predictable cash flows, and natural inflation hedging through regulated contracts. Investors typically participate via private or listed markets.

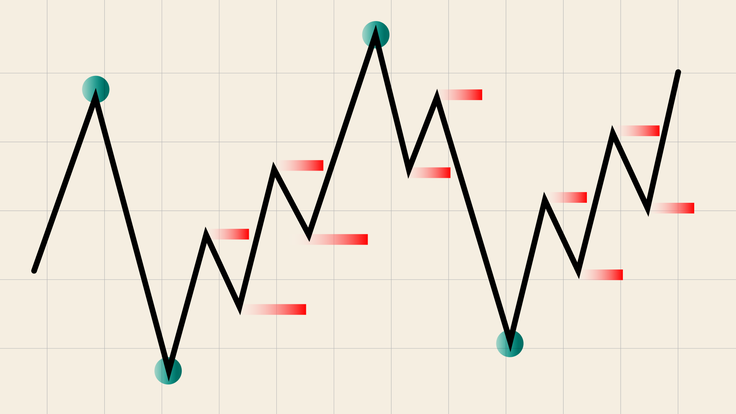
Difference between internal and external structure in ICT
Internal and External Structure are two of the most important concepts in ICT trading because they explain where price is moving now and where it is trying to go next. Many traders learn Break of Structure (BOS), Fair Value Gaps, and Order Blocks without understanding the framework that connects them. Internal and External Structure provide that framework.
What is YoY? Understanding year-over-year comparisons
Year-over-year (YoY) measures change by comparing data from equivalent periods one year apart. It is widely used to assess changes in company performance and economic indicators, from revenue and earnings to inflation and GDP.
9 Sep 2026, 11:42
What is extended-hours trading? Pre-market and after-hours explained
Pre-market and after-hours sessions extend the trading day beyond regular market hours, giving you more flexibility over when you can trade selected stocks and ETFs. Available hours, assets and trading conditions vary between brokers and platforms.
9 Sep 2026, 10:55
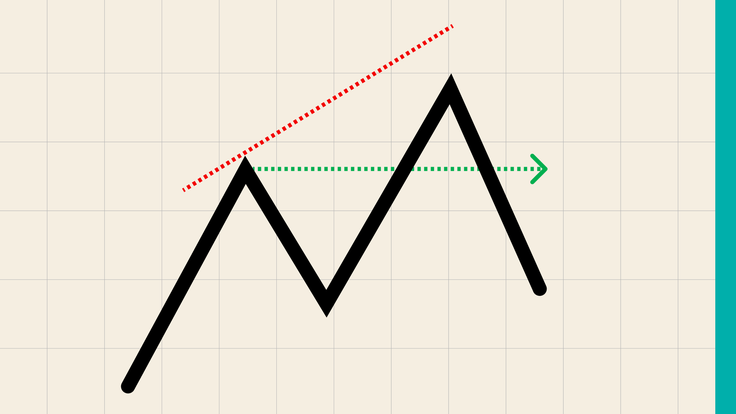
SMT divergence explained: how ICT traders use correlated markets
SMT Divergence is one of the most popular concepts in ICT because it compares two correlated markets instead of analyzing one chart in isolation. The idea is simple: when two markets that normally move together stop confirming each other, the difference can reveal where liquidity is being taken and where a reversal may be developing.
What is the VIX and how is it calculated?
The Volatility Index (VIX) helps traders assess expected volatility and market sentiment through S&P 500 options. This article explains how CBOE’s calculation works and why the index often has an inverse relationship with the S&P 500.

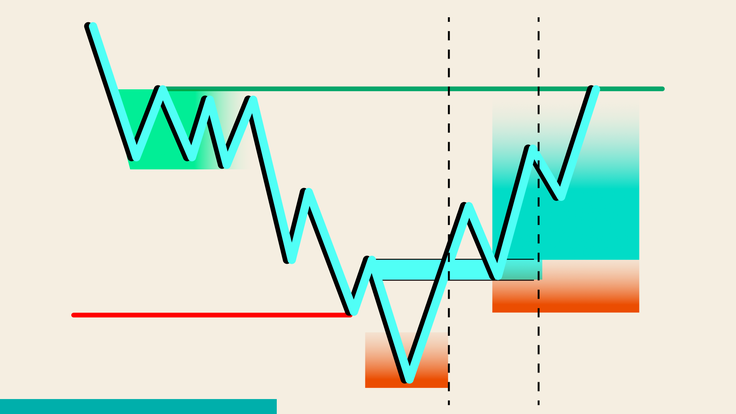
What is the ICT unicorn model?
The ICT Unicorn Strategy is one of the most popular Smart Money Concepts (SMC) entry models because it combines two powerful ideas into one setup: a Breaker Block (BB) and a Fair Value Gap (FVG). Instead of entering immediately after a liquidity sweep, traders wait for price to show confirmation through displacement and then return to a high-probability entry zone.
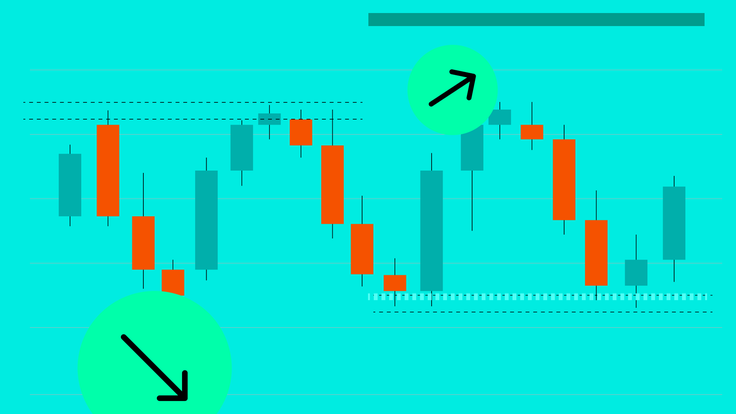
A trader’s guide to read equal highs and equal lows
Equal highs and equal lows are widely followed in Smart Money Concepts (SMC) because they can highlight areas where orders are clustered. This article shows how traders use them to identify liquidity, rather than just chart patterns.
What are commodities in trading?
Commodities connect financial markets with the real economy. Raw materials such as oil, gold, wheat and coffee are traded globally, and their price movements can affect costs, inflation and market confidence.
2 Sep 2026, 09:47
Gas futures trading: a guide to natural gas markets
Trading natural gas futures requires an understanding of the technical aspects of derivative contracts—such as futures, options, and Contracts for Difference (CFDs)—alongside the price behaviour of key global benchmarks including Henry Hub, TTF, and JKM.
