Bitcoin tests key $67,000 level amid high market volatility
Bitcoin is currently testing a critical long-term support zone near the $67,000 level—a pivotal threshold within its existing price action structure. This technical reassessment comes as the cryptocurrency faces significant downward pressure and shifting investor sentiment.

Bitcoin prices have retraced by approximately 45% since reaching a record peak in October 2025.
While current market conditions are characterised by high volatility, historically, substantial drawdowns have been a recurring feature of Bitcoin’s market cycles.
Despite losing its broader bullish structure and trading significantly below its long-term simple moving averages (SMAs), the $67,000 zone remains a vital technical floor that may serve to mitigate current selling pressure.
Bitcoin tests the key $67,000 level amid heightened volatility and selling pressure
Bitcoin is currently navigating a period of intense volatility and sustained selling pressure. Since reaching an all-time high of approximately $124,000 in October 2025, the cryptocurrency has depreciated by roughly 45%. At present, Bitcoin is trading near the $68,000 mark following several days of consecutive declines.
While high volatility and periodic drawdowns are inherent characteristics of the cryptocurrency market, the definitive driver of the current correction remains a subject of debate. Heightened geopolitical and commercial uncertainty have weighed on digital assets over recent months. One prevailing hypothesis suggests that investors are rotating out of high-risk assets in favour of defensive or safe-haven allocations. Paradoxically, however, global equity markets continue to trade near record highs, despite being traditionally classified as risk-on assets.
Furthermore, while Bitcoin has increasingly gained institutional legitimacy through the proliferation of Exchange-Traded Funds (ETFs), the prevailing global uncertainty appears to be recalibrating the behaviour of these institutional participants, many of whom are opting for more traditional capital preservation strategies.
Technical analysis of Bitcoin
From a technical standpoint, Bitcoin has invalidated its long-term bullish structure and is currently subject to significant volatility. Key observations include:
- Trend Context: On the long-term timeframe, Bitcoin is trading below its 50-, 100-, and 200-day Simple Moving Averages (SMAs), reinforcing the prevailing bearish bias. In the short term, price action is characterized by a clear sequence of lower highs and lower lows, signaling sustained downward momentum. However, the asset is currently testing a key structural support level, which could prove decisive for the next directional move.
- Resistance Levels: Should the structural support near $68,000 hold and the price reverses, the primary short-term resistance is identified at $93,000—a level that converges with the 100-day SMA. A decisive break and sustained hold above $93,000 would be required to re-establish a bullish conviction.
- Support Levels: If the $68,000 long-term support is breached to the downside, the next critical floor is located at the $54,000 level. A sustained move below $54,000 would likely accelerate selling pressure and increase the probability of a more profound market correction.
- Momentum Indicators: The Moving Average Convergence Divergence (MACD) continues to exhibit expanding downward momentum, reflecting the strength of the current bearish impulse. Conversely, the Relative Strength Index (RSI) has entered oversold territory. Additionally, the Average True Range (ATR) remains elevated, indicating that volatility persists at high levels. Given these mixed momentum signals, the integrity of the immediate price action structure will likely dictate Bitcoin’s near-term performance.
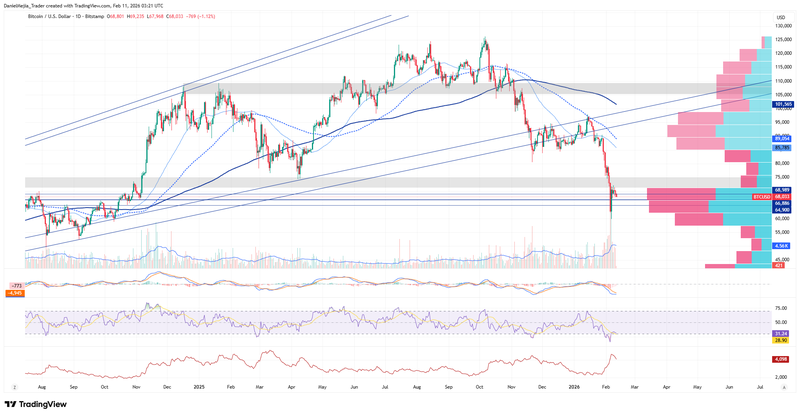
Figure 1. Bitcoin prices (2024–2025). Source: Data from the Bitstamp Exchange; Own analysis conducted via TradingView.


