Dollar index edges higher following positive consumer sentiment report
The US Dollar Index (DXY) advanced by approximately 0.20% following the release of the Conference Board Consumer Confidence Index, which surpassed analyst estimates. From a technical perspective, the DXY is currently testing a critical juncture that holds significance across both long-term and short-term horizons.

The Conference Board Consumer Confidence Index rose from 89.0 to 91.2 points in its latest publication, exceeding the consensus forecast.
Although the latest reading provides a positive signal for US domestic consumption, the broader trend for the indicator remains on a downward trajectory.
The US dollar maintains a bearish trend in the medium and short term; however, momentum indicators—specifically the MACD and RSI—are signalling an upward shift from neutral territories.
Dollar index increases amid better-than-expected consumer confidence
According to data released by the Conference Board, US consumer confidence climbed from 89.0 to 91.2 points, comfortably exceeding the analyst forecast of 87.4. Despite this robust monthly performance, the long-term trend for the index remains in decline. In response to the data, the US Dollar Index (DXY) rose by 0.19% to 97.88, as it tests a pivotal technical resistance zone.
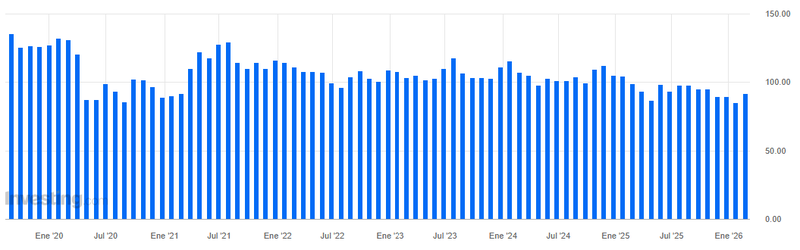
Figure 1. US Conference Board Consumer Confidence (2020–2026). Source: Data from the Conference Board; Figure obtained from Investing.
Technical analysis of the dollar index (DXY)
From a technical perspective, the Dollar Index remains entrenched within a long-term bearish trajectory. The following observations outline the current market structure:
- Trend Context: Over the medium term, the index continues to exhibit a classic bearish structure defined by a sequence of "lower highs" and "lower lows". The DXY is currently trading below its primary 50, 100, and 200-day Simple Moving Averages (SMAs), reinforcing the prevailing downward bias.
- Resistance Levels: To the upside, the 98.00 level constitutes a significant technical hurdle, where price action converges with the 50-day SMA and a short-term pivot point. A decisive breakout above this zone would shift the market's focus toward the 100.00 psychological barrier, which aligns with structural medium-term resistance. A sustained move above 100.00 would indicate a major structural shift toward a higher trading range.
- Support Levels: On the downside, immediate support is identified at 96.50. Should this floor be invalidated, the next critical level is 95.50, which aligns with the lower boundary of the medium-term descending channel. A breach of 95.50 would likely precipitate a more profound market correction.
- Momentum and Volume: Both the Moving Average Convergence Divergence (MACD) and the Relative Strength Index (RSI) are currently exhibiting neutral behaviour; however, both indicators are trending upwards, suggesting a possible recovery in short-term momentum.
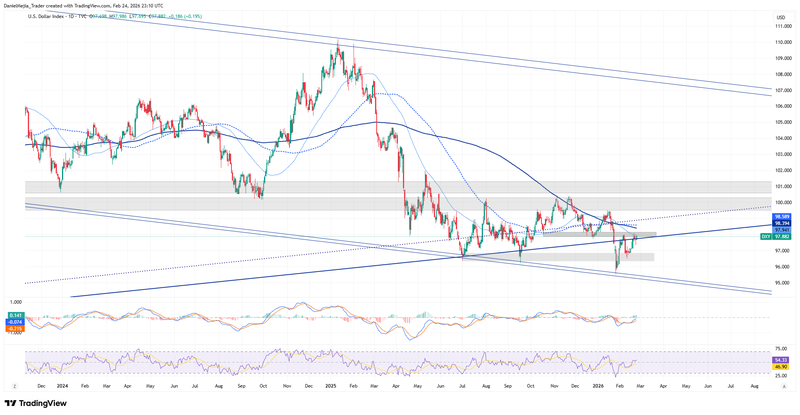
Figure 2. Dollar Index DXY (2024–2026). Source: Data from the Intercontinental Exchange (ICE); own analysis conducted via TradingView.


