Dow nears record as weak payrolls boost monetary easing expectations
The Dow Jones index has closed near its record high amidst elevated expectations of monetary easing from the Federal Reserve, following weakness in private non-farm payrolls revealed by the updated ADP report.

The ADP report indicated a contraction of 32,000 private jobs in November, a decline primarily explained by job losses within small enterprises.
The ADP’s Chief Economist noted that companies are exercising caution due to significant uncertainty regarding consumer behaviour and the macroeconomic environment.
The CME Group’s FedWatch tool updated the probability of a 25-basis point rate cut to 89%, as market participants anticipate the Fed will prioritise addressing labour market weakness over a potential rebound in inflation.
Dow Jones index nears record high amid elevated expectations of monetary easing
According to data from Automatic Data Processing Inc. (ADP), private non-farm payrolls contracted by 32,000, falling significantly short of analysts' estimates which had anticipated an increase of 10,000. Over the past three years, this private indicator has exhibited a clear downward trend, signalling a deterioration within the US employment sector (see Figure 1).
The ADP report identified small enterprises as the segment most severely affected in November by job losses. According to ADP’s Chief Economist, companies are displaying caution due to heightened uncertainty regarding the consumer and the broader macroeconomic environment.
Consequently, the probability of a 25-basis point rate cut at the Federal Reserve’s December meeting has risen to 89%, according to the CME Group’s FedWatch tool. Market participants are pricing in the expectation that the US central bank will weigh the weakness in the labour market more heavily than the risks of the current uncontrolled inflation. As a result, the Dow Jones Industrial Average rose by 0.97% to 47,934.
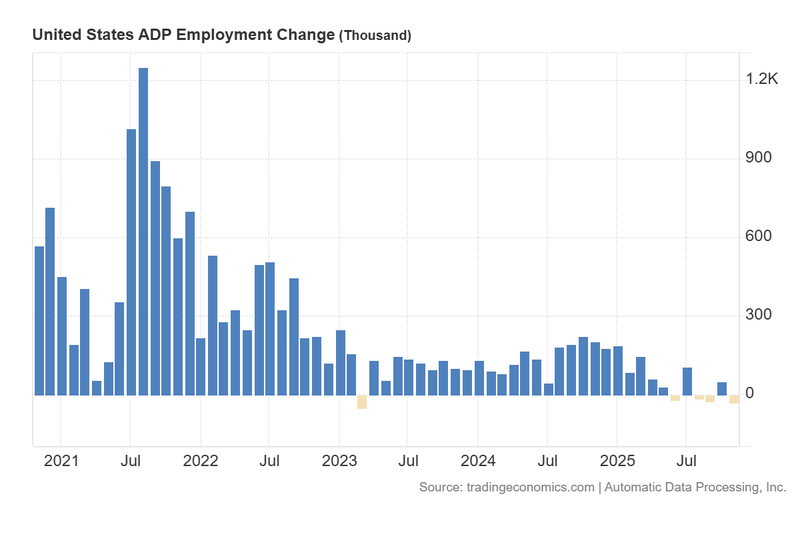
Figure 1. United States ADP Employment Change (2021-2025). Source: Data from Automatic Data Processing; figure obtained from Trading Economics.
Technical analysis of the Dow Jones index
From a technical perspective, the Dow Jones index maintains its long-term bullish trend, with the index continuing to respect its long-term moving averages. Key observations include:
- Trend context. In the long term, the Dow Jones index retains a market structure characterised by higher highs and higher lows. Furthermore, the index is trading above its long-term moving averages (50, 100, and 200 periods), reinforcing the bullish momentum. However, a long-term ceiling is currently being tested, limiting immediate upside movement.
- Resistance levels. Should the short-term resistance at 48,000 be breached to the upside, the next significant ceiling corresponds to the major psychological level of 50,000. A decisive break above these levels would suggest the potential for an extension into higher price zones.
- Support levels. If the support at 45,500 (coinciding with the 100-day moving average) is broken to the downside, the next relevant floor is located at 44,000 (proximate to the 200-day moving average). A loss of the 44,000 zone would increase the probability of a deeper market correction.
- Momentum indicators. The MACD displays a bearish divergence, signalling a potential weakening of the prevailing bullish trend. Furthermore, the RSI oscillator is approaching overbought levels, suggesting the bullish trend may be overextended.
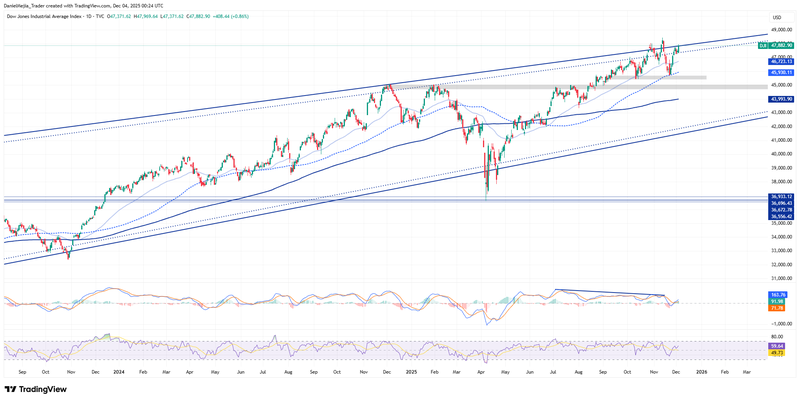
Figure 2. Dow Jones index (2023-2025). Source: Data Own analysis conducted via TradingView.


