Euro holds in range amid German weakness and US uncertainty
The Euro is forming a consolidation pattern amidst economic uncertainty in key European nations such as Germany, and ambiguity regarding the Federal Reserve's monetary policy stance for the year 2026.

German exports rose by 0.1% in October (MoM), whereas imports declined by 1.2%, reflecting mixed economic data.
In the US, the JOLTS report indicated a recovery during September and October, contrasting with recent employment data which has exhibited weakness in the latest periods.
The Euro is oscillating within a consolidation phase (range) amidst a divergence between weak economic growth in European countries and uncertainty regarding the Federal Reserve's next steps.
US JOLTS report shows recovery, while German trade data shows mixed results
The Euro reflects uncertainty within a consolidation phase that commenced in June 2025. While the economic context in major European economies like Germany indicates weakness, the United States economy presents a divergence between weak employment data and inflation rates that remain uncontrolled by the Federal Reserve.
Regarding current data from the European Union's largest economy, Germany, the Federal Statistical Office reported that exports decelerated slightly from 1.5% to 0.1% in October (MoM), though this remained above the analyst estimate of -0.2%. Conversely, imports dropped by 1.2% (down from +3.1% in the previous month), falling below analysts' expectations of +0.2%. The German economy has experienced difficulties, characterised by economic stagnation (GDP of 0% in Q3) and an unemployment rate of 6.3%—the highest level in three years.
On the other hand, according to data from the US Bureau of Labor Statistics, the Job Openings and Labor Turnover Survey (JOLTS) showed an increase for the months of September and October, updating to 7.67 million (exceeding analysts’ expectations). Although this labour data is somewhat lagged, it signals a recovery within an economic context where other employment metrics had shown significant deterioration in recent months.
This current information correlates with recent revisions to US initial jobless claims, where indicators displayed a slight recovery. However, the latest reading of the ADP report—private employment data—indicated a contraction, highlighting a contrast between different sources of economic information.
Market participants await the US central bank's December meeting (December 10), which may be characterised by heightened uncertainty as the institution lacks updated official data, its independence is being questioned, and global central banks are exhibiting significant divergence in their current economic outlooks.
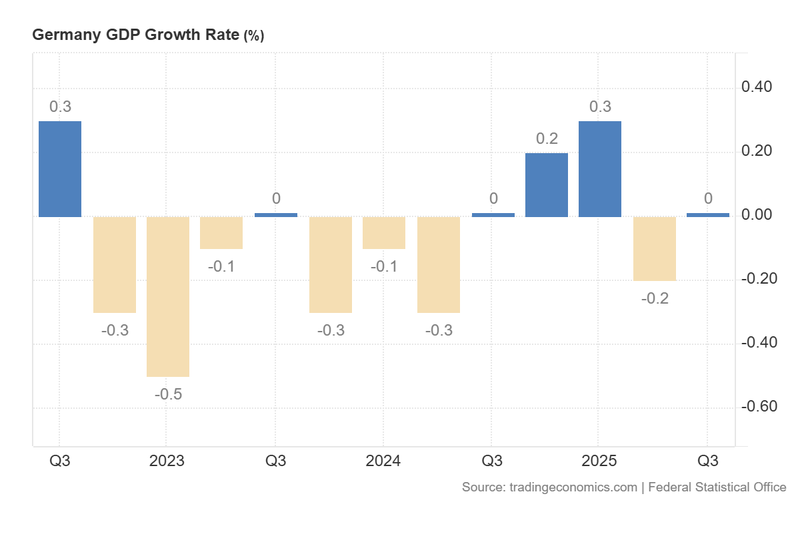
Figure 1. German GDP Growth Rate (quarter-on-quarter). Source: Data from the Federal Statistical Office; chart obtained from Trading Economics.
Technical analysis of the EUR/USD pair
From a technical perspective, the EUR/USD pair remains in a broader bullish trend; however, in the short term, the price is forming a consolidation structure. Key observations include:
- Trend context. In the long term, the EUR/USD pair has exhibited a bullish trend—defined by a structure of higher highs and higher lows; however, in the short term, the Euro is trading within a range or consolidation phase between $1.1470 and $1.1860.
- Resistance levels. Should the short-term resistance at $1.1707 be breached to the upside, the next significant ceiling corresponds to the level of $1.1870 (structural resistance). A decisive break above these levels would suggest the potential for an extension into higher price zones.
- Support levels. If the short-term support at $1.1480 is broken to the downside, the next relevant floor is located at $1.1230 (a structural pivot point). A loss of the $1.1230 zone would increase the probability of a deeper market correction.
- Momentum indicators and Volume. The MACD is displaying a bearish divergence, implying a weakening of the bullish trend. Meanwhile, the RSI oscillator is hovering near the neutral zone. Additionally, the volume profile indicates a significant distribution near the structural resistance of 1.1900.
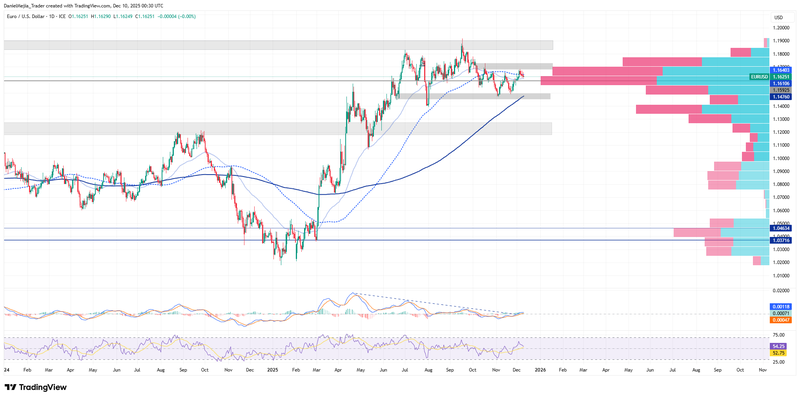
Figure 2. EUR/USD pair (2024-2025). Source: Own analysis conducted via TradingView.


