Euro signals uncertainty against US dollar amid dip in economic sentiment
The Euro area’s ZEW Economic Sentiment Index recorded a marginal decline in its February reading, falling short of market expectations. The EUR/USD pair has exhibited a period of indecision, trading within a symmetrical triangle chart pattern.

The Centre for European Economic Research (ZEW) published its Economic Sentiment Index, which declined from 40.8 points in January to 39.4 in February.
Approximately 53% of surveyed analysts anticipated no immediate change in economic activity, while 43% remained optimistic about potential improvements.
The EUR/USD pair closed the session forming a "Doji" candlestick, a technical signal typically associated with market uncertainty, as it continues to consolidate within a triangle formation.
ZEW economic sentiment index declines slightly, undershooting market forecasts
According to data released by the Centre for European Economic Research (ZEW), the Eurozone’s Economic Sentiment Index edged down from 40.8 points in January to 39.4 points in February. This reading was considerably lower than the consensus analyst forecast of 45.2 points. While the current level does not represent a significant historical downturn, the data indicates that investor confidence is being increasingly tempered by regional and global uncertainties. Information from Trading Economics reveals that 52.6% of surveyed analysts expected economic activity to remain unchanged, 43.4% forecasted an improvement, and a minor 4.0% predicted a deterioration.
Regarding the immediate market reaction, the Euro rose marginally by 0.02% to $1.1853 against the US dollar. The pair concluded the session with a "Doji" candlestick, indicating a lack of directional conviction among traders. Market participants have now shifted their focus to the US PCE Price Index, scheduled for release on Friday, 20 February, which is expected to provide further clarity on the Federal Reserve's monetary policy path.
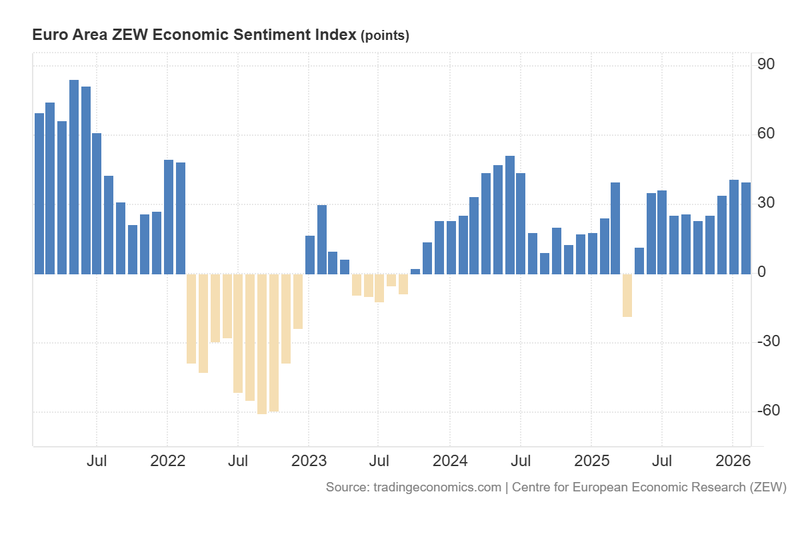
Figure 1. Euro Area ZEW Economic Sentiment Index (2021–2026). Source: Data from the Centre for European Economic Research (ZEW); Figure obtained from Trading Economics.
Technical analysis of the EUR/USD pair
From a technical perspective, the EUR/USD pair remains embedded within a broader bullish trend; however, short-term price action is currently restricted within a triangle pattern that signals mounting uncertainty. Key observations include:
- Trend Context: Over the long term, the EUR/USD pair has maintained a bullish market structure defined by a series of higher highs and higher lows. The price continues to trade above the 50, 100, and 200-day Simple Moving Averages (SMAs). Nevertheless, in the short term, the Euro is consolidating within a triangle pattern in close proximity to a structural resistance level that is currently inhibiting further upward momentum.
- Resistance Levels: Should the immediate short-term resistance at $1.1860 be breached, the next significant technical ceiling is identified at $1.2113—level that marks the upper boundary of a primary bullish channel. A decisive breakout above this zone would signal the potential for an extension toward higher price targets.
- Support Levels: If the $1.1630 support level is compromised—a critical zone where the 200-day SMA converges with the floor of the bullish channel—the next relevant floor is located at the $1.1230 structural pivot point. A breach of the $1.1230 zone would significantly increase the probability of a deeper market correction.
- Momentum Indicators: Both the Moving Average Convergence Divergence (MACD) and the Relative Strength Index (RSI) are currently hovering near neutral zones, reinforcing the hypothesis of a period of range-bound uncertainty.
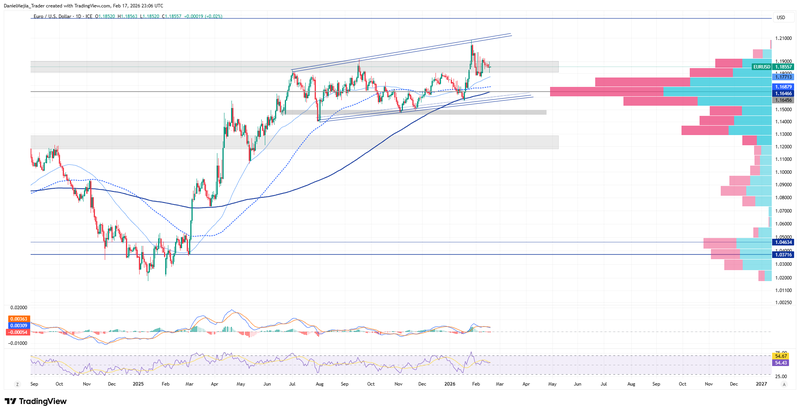
Figure 2. EUR/USD pair (2024–2026). Source: Data from the Intercontinental Exchange (ICE); own analysis conducted via TradingView.


