Meta exceeds earnings expectations: Financial and technical review
Meta Platforms has outperformed analyst expectations for both total revenue and net income in its latest quarterly report. Financial analysis indicates a sustained trajectory of growth in revenue and capital investment, contrasted by a historically inconsistent net income growth rate.

Meta’s quarterly revenue surged by 24% year-on-year (YoY) to reach $59.89 billion, while earnings per share (EPS) climbed 11% to $8.88 during the same period.
While the primary trends for revenue and total investment remain robustly bullish, the net income growth rate continues to display significant historical variability.
Despite a clear long-term bullish trend in Meta’s share price, short-term price action has shifted into a consolidation phase.
Meta platforms releases a robust quarterly financial report
Meta Platforms recently disclosed its quarterly financial results, reporting total revenue of $59.89 billion, comfortably exceeding the consensus forecast of $58.35 billion. In turn, the earnings per share (EPS) reached $8.88, surpassing the anticipated $8.19. These figures represent a 23.8% YoY surge in revenue and a 10.7% increase in EPS. Market reaction was immediate; Meta’s share price rose by more than 6% in after-hours trading, although pricing was characterised by high variability as investors digested the broader implications of the report.
Financial analysis of Meta Platforms
From a fundamental perspective, Meta has demonstrated a sustained upward trajectory in both total revenue and net income over a multi-year horizon. The YoY revenue growth rate has remained remarkably stable, averaging approximately 21%. In contrast, the net income growth rate has been defined by high volatility, averaging 27% but experiencing extreme fluctuations—peaking at 128% in 2024 after a low of –42% in 2023.
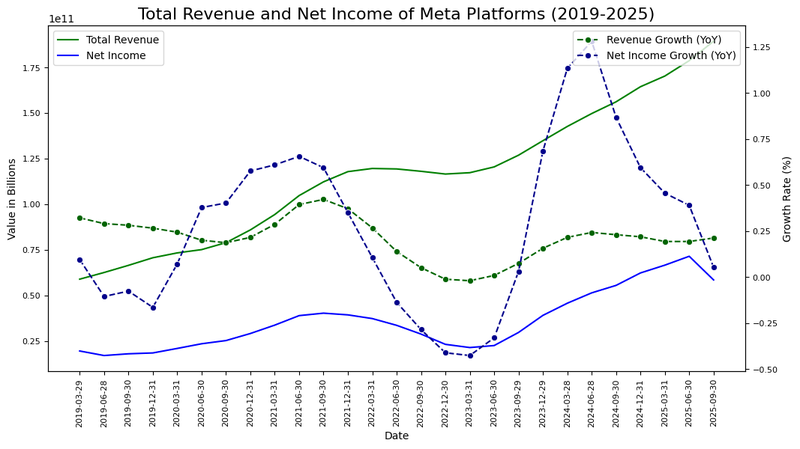
Figure 1. Total revenue, net income, revenue growth rate, and net income growth rate of Meta Platforms (2019–2025). Source: Own analysis using data from the Nasdaq Exchange.
As illustrated in Figure 2, Meta's net margin has likewise undergone significant variation. The average net margin over this period stands at 30%, with a high of 39% in 2025 and a cyclical low of 18% in 2023. Nevertheless, the recent strengthening of Meta’s net margin is a notable development for long-term profitability.
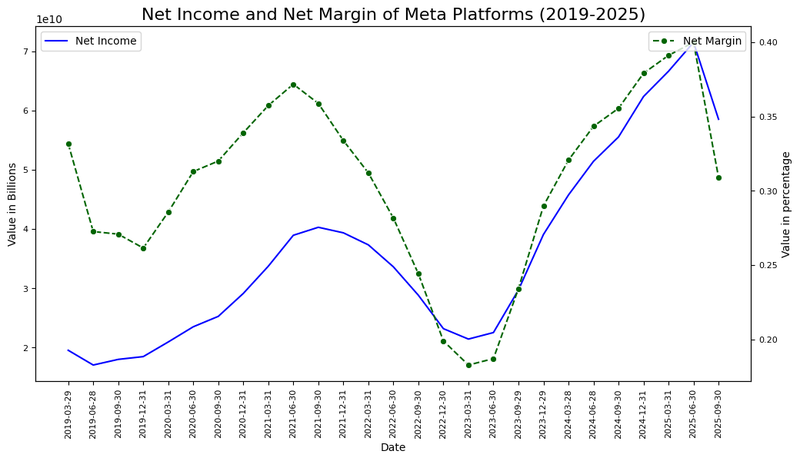
Figure 2. Net margin trend and profitability analysis of Meta Platforms (2019–2025). Source: Own analysis using data from the Nasdaq Exchange.
Figure 3 highlights a consistent expansion of total assets since 2014, reflecting the firm’s unwavering commitment to infrastructure investment and scale. This growth has been supported by a strategic increase in leverage; the debt-to-asset ratio has risen from 0.5% in 2014 to 18% in 2024. Despite this increase, current debt levels remain conservative and highly manageable when compared to peers in the sector. In summary, Meta Platforms exhibits formidable growth in revenue and asset accumulation, though its net income history remains punctuated by periodic volatility.
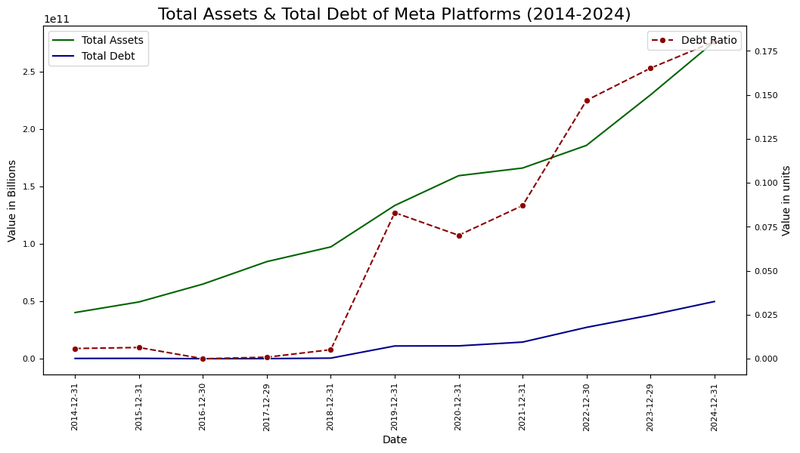
Figure 3. Total assets, total debt, and debt ratio of Meta Platforms (2012–2025). Source: Own analysis using data from the Nasdaq Exchange.
Technical analysis of Meta’s share price
Regarding the technical outlook, while Meta’s share price maintains its primary long-term bullish trajectory, recent months have seen the asset enter a consolidation pattern. Key observations include:
- Trend Context: Over the long term, Meta Platforms preserves a market structure defined by "higher highs" and "higher lows" within a well-defined bullish channel. However, the price is currently trading below its 100-day and 200-day simple moving averages (SMAs). Furthermore, both the Moving Average Convergence Divergence (MACD) and the Relative Strength Index (RSI) are hovering near neutral levels, indicating a lack of momentum required to break out of the current range.
- Resistance Levels: Should price action breach the short-term resistance at $675—a level currently coinciding with the 200-day SMA—the next significant technical ceiling is the historical peak of $785. A decisive close above this level would likely signal the start of a new expansionary phase toward higher price targets.
- Support Levels: If the immediate support at $600 is invalidated, the next critical floor is identified at $500. This level aligns with the Point of Control (POC) on the Volume Profile. A failure to defend the $500 zone would significantly increase the probability of a more substantial market correction.
- Momentum and Volume: The current neutral performance of the MACD and RSI suggest that the stock may remain range-bound in the near term as the market seeks a new catalyst for directional movement.
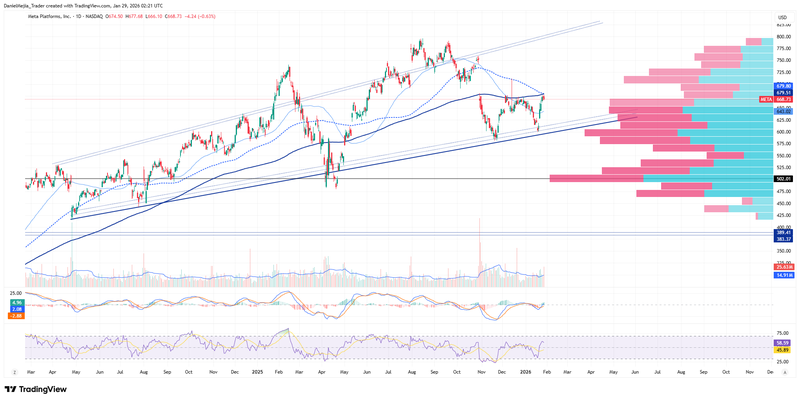
Figure 4. Meta’s share price performance and technical indicators (2024–2026). Source: Data from the Nasdaq Exchange; Own analysis conducted via TradingView.


