Micron analysis: expanding opportunities in memory and storage
Micron’s share price rose by 7.76% to reach $362.75, attaining a new historical peak amidst growing optimism surrounding Artificial Intelligence (AI) systems that require vast quantities of memory. As a global leader in memory and storage solutions, Micron is strategically positioning itself to capitalise on this demand to bolster its revenue growth and profit margins.

The share price achieved a record high of $362.75 during the most recent trading session.
Micron waits for a sustained demand for high-capacity memory and storage driven by the proliferation of large-scale AI models.
Micron’s share price has had an accumulated performance of 307% since 2025, though indicators suggest the stock is approaching overbought territory.
Demand for memory and storage within artificial intelligence ecosystems continues to rise consistently; Micron rises
Micron’s recent 7.76% surge to $362.75 per share reflects an optimistic market sentiment in the firm. Since the start of 2025, the company has seen a valuation increase of approximately 307%. Market participants attribute this growth to the leadership in memory and storage in the hardware stack; as a primary manufacturer, Micron’s future cash flow expectations remain highly optimistic.
Memory is a critical component in AI systems, enabling the execution of complex models using massive datasets. Recognising its leadership in this expanding sector, the company is committing significant Capital Expenditure (CapEx) to enhance production capacity and operational productivity. In essence, the market is pricing in a sustained trajectory of revenue growth as Micron leverages the current evolution of AI technologies.
Financial analysis of Micron Technology
From a fundamental perspective, Micron has exhibited stable growth across several key financial metrics.
Figure 1 illustrates the significant recovery in total revenue since May 2024, during which the growth rate improved to an average of 54%. Correspondingly, net income demonstrated a prominent recovery in growth by August 2025. Both total revenue and net income have experienced a sustained recovery since November 2023, when financial trends entered a bullish phase that has remained consistent to date.
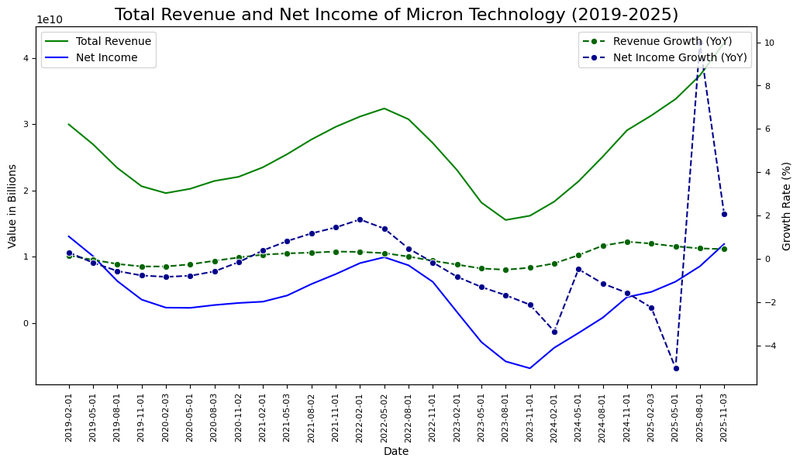
Figure 1. Total revenue, net income, revenue growth rate, and net income growth rate of Micron Technology (2019-2025). Source: Own analysis using data from the Nasdaq Exchange.
Furthermore, figure 2 demonstrates that Micron’s assets have increased consistently throughout its history. Crucially, total debt has been managed effectively relative to this growth. Consequently, the debt ratio has stabilised at approximately 20%, significantly decreasing leverage risk even as the company continues its expansionary phase.
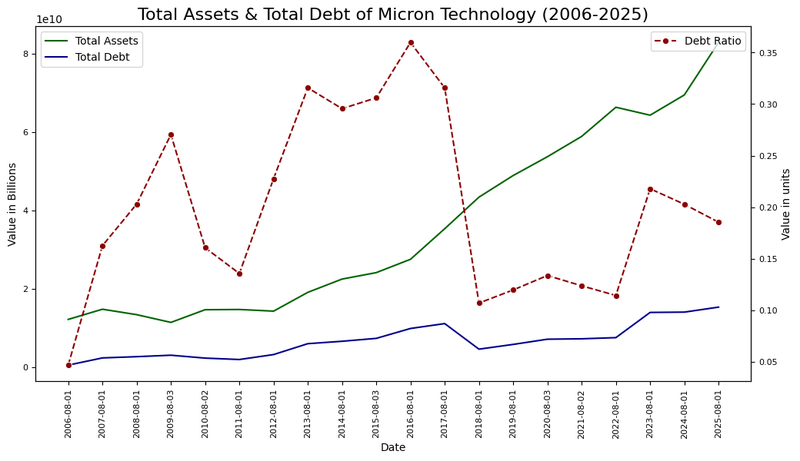
Figure 2. Total assets, total debt, and debt ratio of Micron Technology (2006-2025). Source: Own analysis using data from the Nasdaq Exchange.
Technical analysis of Micron’s share price
Regarding the technical outlook, Micron’s share price maintains its primary bullish trend. Key observations include:
- Trend Context: In the long term, Micron Technology retains a market structure characterised by higher highs and higher lows. The share price is currently trading considerably above its 50, 100, and 200-period moving averages. However, momentum indicators suggest the price is approaching overbought zones.
- Resistance Levels: Should the short-term resistance at $364 be breached to the upside, the next significant ceiling is the $400 level—a prominent psychological barrier. A decisive breakout above $400 would suggest an extension into new "price discovery" zones.
- Support Levels: If the support at $330 is breached, the next relevant floor is situated at $280. This level represents the base of the expansive bullish channel and aligns approximately with the 50-period moving average. A failure to hold the $280 zone would increase the probability of a more pronounced market correction.
- Momentum Indicators and Volume: The MACD (Moving Average Convergence Divergence) exhibits a strong upward trend, though current levels are historically elevated, suggesting overbought conditions. Similarly, the RSI (Relative Strength Index) is trading in overbought territory. While the primary trend remains bullish, these indicators signal potential fatigue in the upward momentum.
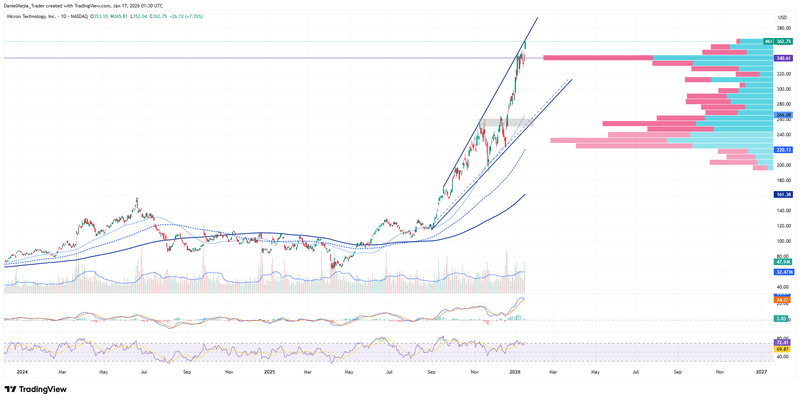
Figure 3. Micron’s shares price (2024-2025). Source: Data from the Nasdaq Exchange; Own analysis conducted via TradingView.


