Microsoft takes the lead in efficiency
Microsoft remains a cornerstone for institutional portfolios. While the broader tech sector has faced valuation scrutiny, Microsoft’s recent financial prints suggest a company that isn't just growing is becoming more efficient as it scales.

Forward P/E of 20.65 is cheaper than approximately 65% of its peer group.
Google’s historical alpha was driven by total market capture, but Microsoft is now winning the "efficiency war."
First target for a rebound could be $440 resistance.
Fortress balance sheet
Microsoft’s internal health remains among the strongest in the S&P 500, characterized by extreme solvency and low reliance on external credit markets. The company maintains a remarkably low debt-to-equity ratio of 0.23. More impressively, its debt-to-free cash-flow ratio sits at 1.30.
In a 2026 environment where interest rates have stabilized but remain higher than the "zero-bound" era, Microsoft’s ability to clear its entire debt load with just 15 months of cash flow is a massive competitive advantage. An Altman-Z score of 8.36 virtually eliminates "tail risk" or bankruptcy concerns, allowing management to pursue aggressive R&D and acquisitions without jeopardizing the firm’s credit rating.
Growth at a reasonable price
Despite its dominance, Microsoft’s current market pricing suggests it is undervalued compared to its own sub-sector.
MSFT is trading at a P/E ratio of 26.09, which is significantly lower than the broader software industry average of 33+. Its forward P/E of 20.65 is cheaper than approximately 65% of its peer group.
The market appears to be discounting Microsoft’s earnings power. With Net Income up 29% YoY and Revenue up 17% YoY, the company is delivering high-double-digit growth while trading at a discount to "pure-play" software firms. This suggests a "valuation gap" that is likely to close as the market recognizes Microsoft’s superior operating margins, which saw operating income jump 21% YoY.
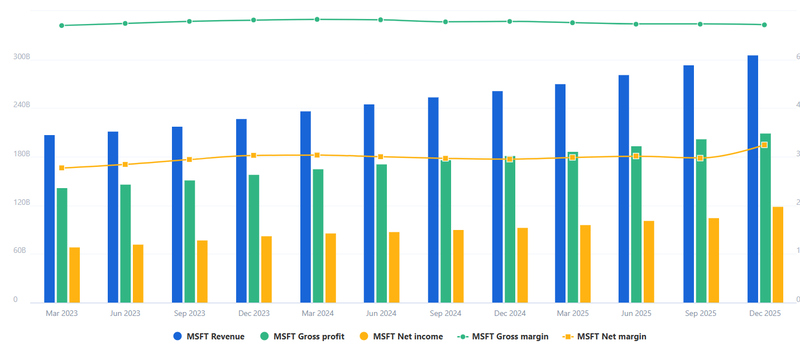
Source: Fullratio
The battle of growth trajectories
The rivalry between Microsoft and Alphabet has entered a new phase. While Google has seen massive historical growth (over 1,900% since 2010), its growth rate is beginning to decelerate, with forecasts dipping to 10% by 2028. Conversely, Microsoft’s revenue growth is accelerating, with a 19% forecast for 2026 and staying resilient at 16% through 2028.
Interestingly, the stock market favored Google’s aggressive expansion through late 2025, with GOOGL outperforming MSFT significantly. However, the early 2026 trend shows a sharp correction in Google’s price while Microsoft remains relatively stable.
We are seeing a "rotation of quality." Google’s historical alpha was driven by total market capture, but Microsoft is now winning the "efficiency war." The fact that Microsoft is projected to have a higher growth rate than Google in 2026 (19% vs 16%) despite having a more diversified and stable revenue base makes it the most attractive risk-adjusted play for the next 24 months.
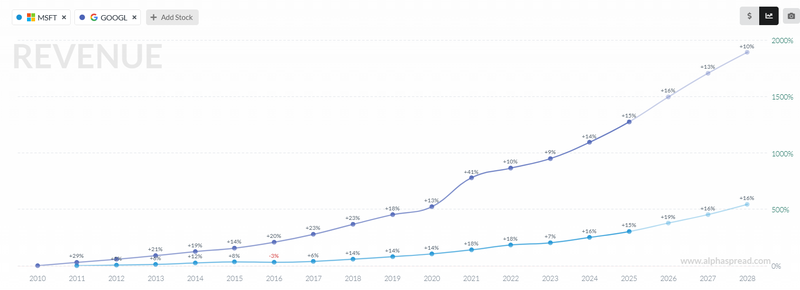
Source: Alpha Spread
Technical outlook
MSFT is currently trading at $396.86, having retraced from peaks near $560. It has landed precisely on a long-term trendline that has acted as a support since early 2023.
The Relative Strength Index has plummeted to 28.39 when you combine this with a Forward P/E of 20.65 and 29% Net Income growth, the technicals suggest that the "sell-off" has overshot the fundamentals. Predictively, this $396 level is a major pivot; if it is held above the trendline, the first target for a rebound could be $440 resistance.
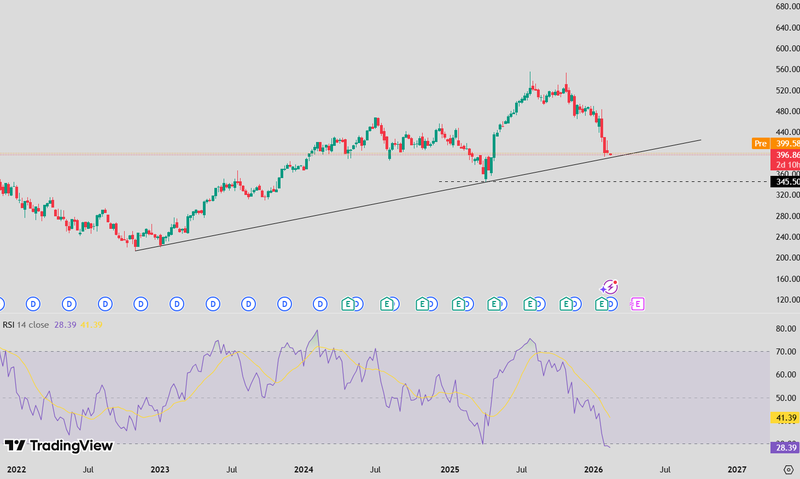
Source: Trading View


