Nasdaq approaches record high following Fed rate cut
The Nasdaq index closed with gains following the Federal Reserve's decision to cut its benchmark interest rate, edging closer to its historical peak and maintaining its long-term bullish trend.

The Federal Reserve cut its benchmark interest rate by 25 basis points to 3.75%, whilst signalling a neutral stance for the year 2026.
The US central bank upgraded its economic outlook for the coming years; however, it acknowledged that the current context is complex, citing a divergence between a persistently elevated inflation rate and emerging weakness in the labour sector.
The index has resumed its long-term bullish trend; however, technical momentum indicators display divergences that could suggest a deceleration or an impending consolidation phase.
Fed adopts neutral stance amid mandate divergence
The Federal Reserve decided to lower its benchmark interest rate by 25 basis points to 3.75%. Concurrently, the central bank updated its economic outlook for the coming years, generally reflecting improved expectations compared to previous projections.
Regarding the most significant revisions, the projection for real GDP growth in 2026 was revised upwards from 1.8% to 2.3%, while the PCE inflation projection was lowered from 2.6% to 2.4%. However, projections for the unemployment rate and the federal funds rate remained unchanged at 4.4% and 3.4%, respectively.
In the press conference led by Chair Jerome Powell, several key topics were addressed. The central bank anticipates that the improvement in the US economy will be driven by robust consumption and investment in artificial intelligence (AI). Furthermore, the Fed intends to increase Treasury bond purchases over the coming months to support liquidity in bond markets.
Despite the improved economic outlook, the Federal Reserve conveyed messages of uncertainty, adopting a neutral stance while awaiting updated economic data. The central bank regards the current environment as complex, given that its dual mandate—inflation control and maximum employment—is facing conflicting pressures. The Fed remains uncertain regarding the actual inflationary impact of US tariffs. Consequently, the central bank plans to maintain its data-dependent, meeting-by-meeting approach.
Another relevant topic is the divergence of opinion within the Federal Open Market Committee (FOMC) regarding future decisions. Although the consensus anticipates another rate cut next year, significant variation exists among members regarding the appropriate monetary policy path.
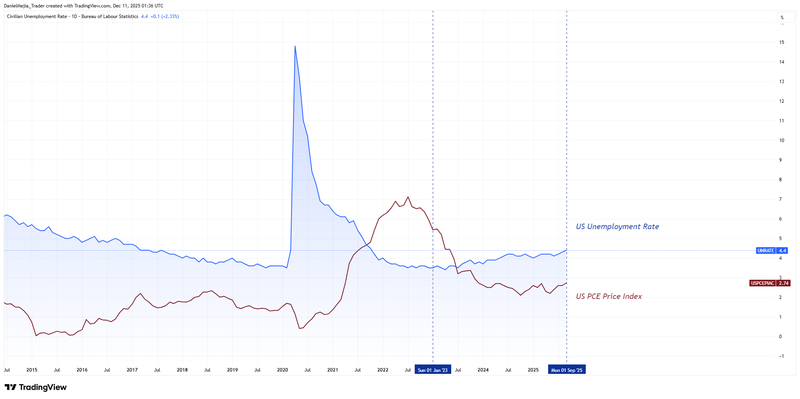
Figure 1. US Unemployment Rate versus PCE Price Index (2015-2025). Source: Data from the Bureau of Labor Statistics and the Bureau of Economic Analysis; own analysis conducted via TradingView.
Technical analysis of the Nasdaq index
From a technical perspective, the Nasdaq index remains within its long-term bullish trend. Key observations include:
- Trend context. In the long term, the Nasdaq index maintains a market structure characterised by higher highs and higher lows, and continues to respect its long-term moving averages (50, 100, and 200 periods).
- Resistance levels. Should the resistance at 26,100 (historical high) be breached to the upside, the next relevant ceiling corresponds to 27,000 (a significant psychological level). A decisive break above these levels would suggest potential for further appreciation.
- Support levels. If the support at 24,200 (short-term support and the 100-day moving average) is broken to the downside, the next relevant floor is 22,200 (proximate to the 200-day moving average and a structural support level). A loss of the 22,200 zone would increase the probability of a deeper correction.
- Momentum indicators. The MACD displays a bearish divergence, signalling a potential weakening of the bullish trend. Meanwhile, the RSI is exhibiting a downward trend characterised by lower highs.
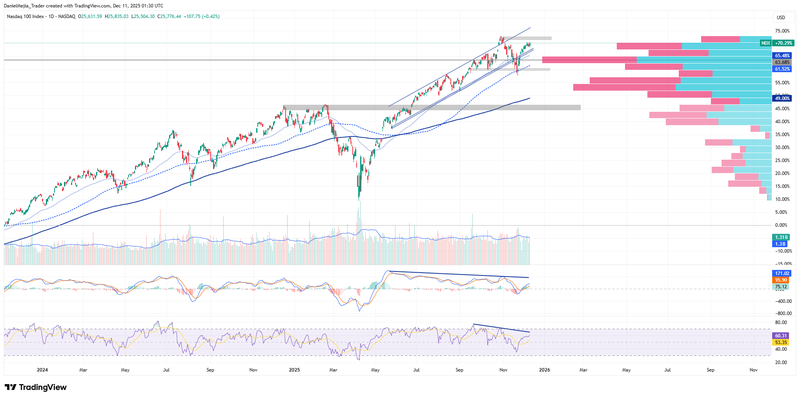
Figure 2. Nasdaq index (2024-2025). Source: Data from the Nasdaq Exchange; own analysis conducted via TradingView.


