Nasdaq falls, breaks key technical level amid geopolitical risks
The Nasdaq 100 index experienced a 2.38% decline at the market close, marking a cumulative depreciation of approximately 10% from its recent record peak. The technology-heavy index is facing significant pressure from mounting inflationary risks and the prospect of a hawkish shift in the Federal Reserve’s monetary policy stance.

Hopes for a diplomatic resolution to the conflict involving the United States, Israel, and Iran have diminished, exerting downward pressure on US equity indices while driving renewed appreciation in energy markets.
The Nasdaq 100 has suffered a sharp contraction due to its inherent sensitivity to high-interest-rate environments—a scenario increasingly likely should surging energy costs bolsters inflation.
Despite a sustained long-term bullish trend, the index is currently breaching pivotal support levels, notably its short-term structural floor and the 50, 100, and 200-day Simple Moving Averages (SMAs).
Persistent tensions in the Middle East pressure Nasdaq amid shift in Fed outlook
Geopolitical volatility involving the United States, Israel, and Iran continues to destabilise global markets. According to reports from Reuters, a senior Iranian official characterised the latest US peace proposal as "one-sided and unfair". This diplomatic friction has been further exacerbated by the rhetoric of US president Donald Trump, which has pivoted back toward explicit threats of aggressive military action should negotiations fail to reach an agreement.
The conflict in the Middle East has precipitated severe disruptions to the energy supply chain. The Strait of Hormuz—a critical maritime artery through which approximately 20% of the global supply of oil and liquefied natural gas (LNG) transits—remains closed, with no immediate indications of a reopening. Furthermore, damage to key energy infrastructure around the Gulf has generated heightened concerns regarding inflationary pressures, should the conflict escalate or become protracted.
Consequently, the Federal Reserve may be compelled to adopt a more restrictive 'higher-for-longer' policy if energy prices continue their upward trajectory. Such a scenario would likely prevent US inflation rates from converging with the Fed’s 2% target (the current PCE Price Index stands at 2.8%). An economic outlook defined by persistent inflation and elevated interest rates is unfavourable for equities, as growth-oriented projects become more difficult to finance and stock valuations are discounted more heavily.
Against this backdrop, the Nasdaq 100 index dropped 2.38% to 23,586 points, as technology firms exhibit a heightened sensitivity to hawkish monetary policy. Crucially, the index has breached a significant short-term technical support level, raising the probability of a further retracement based on recent price action.
Technical analysis of the Nasdaq-100 index
From a technical perspective, the Nasdaq index preserves its long-term bullish trajectory, although it is currently navigating a period of significant consolidation. Key observations include:
- Trend Context: In the long term, the Nasdaq retains a bullish market structure characterised by a sequence of higher highs and higher lows. However, over the past four months, the index has transitioned into a horizontal, range-bound pattern.
- Resistance Levels: Should the index breach current resistance at 26,100 (its historical peak), the next significant ceiling is identified at 27,000—a major psychological threshold. A decisive break above these levels would signal a continuation of the primary uptrend.
- Support Levels: If the immediate support at 24,000 is invalidated, the next critical structural floor is located at 22,000 (a structural support). A breach of the 22,000 zone would significantly increase the probability of a more profound market correction.
- Momentum Indicators: Both the Moving Average Convergence Divergence (MACD) and the Relative Strength Index (RSI) are exhibiting lower highs. This bearish divergence suggests that the prevailing bullish momentum is exhausting in the near term.
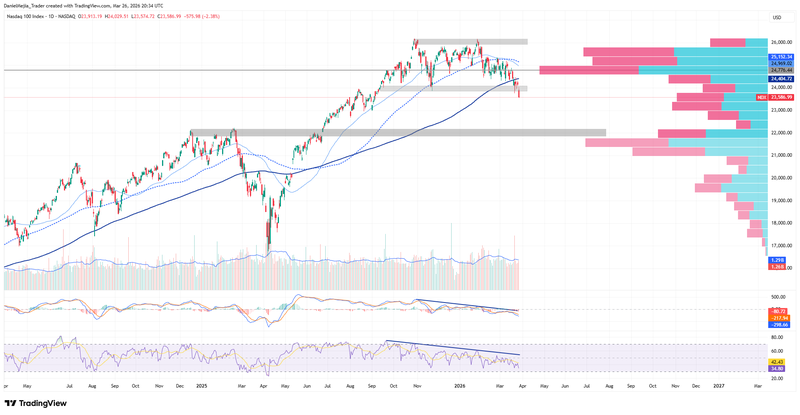
Figure 1. Nasdaq index (2024–2025). Source: Data from the Nasdaq Exchange; own analysis conducted via TradingView.


